
Figure 1.
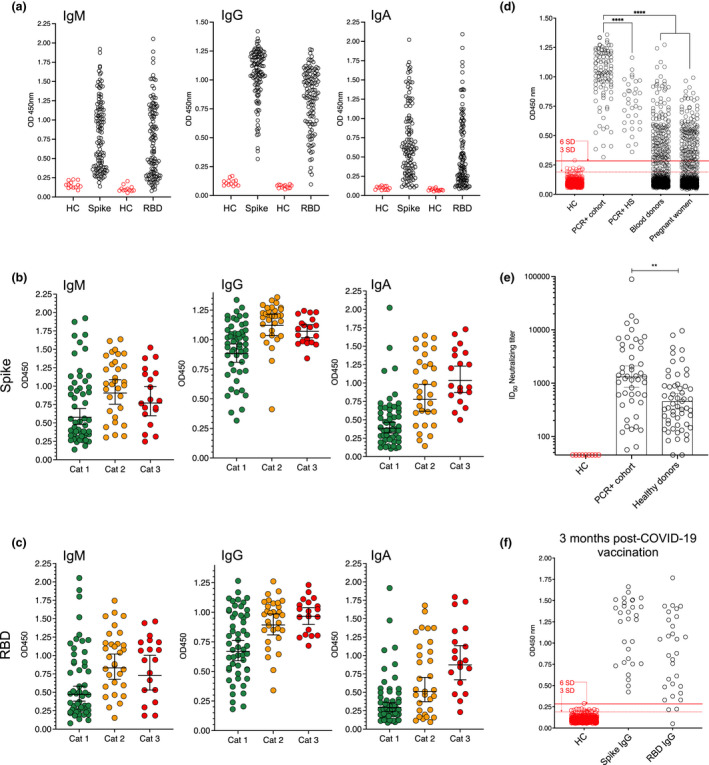
Anti‐SARS‐CoV‐2 Ab responses in RT‐PCR+ and vaccinated individuals are spread over a wide titer range. (a) IgM, IgG and IgA anti‐S and –RBD responses in individuals RT‐PCR+ for SARS‐CoV‐2 RNA (COVID‐19 patients and hospital staff, n = 138). A small number of healthy controls (HC, pre‐pandemic samples) are shown for each assay and isotype. (b) Anti‐S isotype‐level responses according to COVID‐19 clinical status. Cat 1: mild/asymptomatic. Cat 2: hospitalized. Cat 3: Intensive care. (c) Anti‐RBD isotype‐level responses according to COVID‐19 clinical status. (d) Anti‐S responses in RT‐PCR+ cases (n = 105), RT‐PCR+ hospital staff (HS, n = 33), blood donor (n = 1000) and pregnant women (n = 1000) serum samples collected during the first three months of the pandemic. 3 and 6 SD cutoffs calculated from n = 595 historical control samples are shown by dashed and solid red lines, respectively. (e) Neutralizing ID50 titers in RT‐PCR+ individuals and a subset of healthy donors (n = 56) collected during the first three months of the pandemic. (f) Anti‐S and ‐RBD IgG responses 3 months post‐boost in individuals vaccinated with either BNT162b2 (n = 10), mRNA‐1273 (n = 10) or ChAdOx1 (n = 10) COVID‐19 vaccines. 3 and 6 SD cutoffs are shown by dashed and solid red lines, respectively. Error bars represent the geometric mean with 95% CIs.