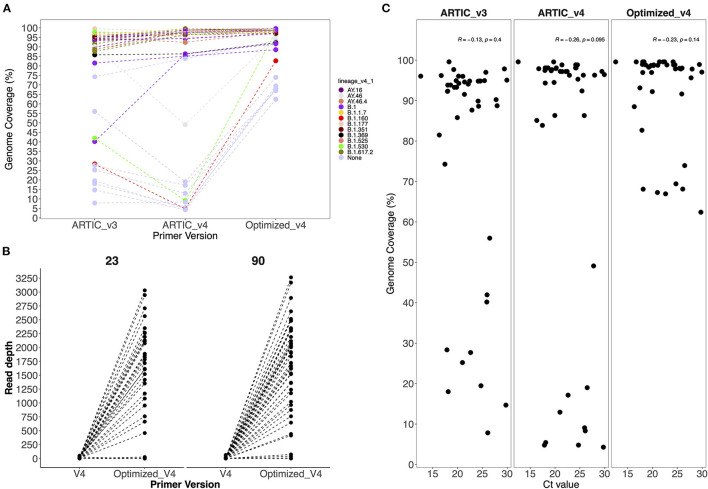
Figure 2.
(A) Comparison of genome coverage across all sequences generated by the V3, V4 and optimized V4 primers and (B) Comparison of the average amplicon depth from amplicons 23 and 90 when using V4 and optimized V4 primers. Primer version is on the x-axis and amplicon depth on the y-axis. (C) Comparison of Ct values against genome coverage for V3, V4 and optimized V4 primer sets. Each dot represents a sample whose Ct value is highlighted in the x axis.

