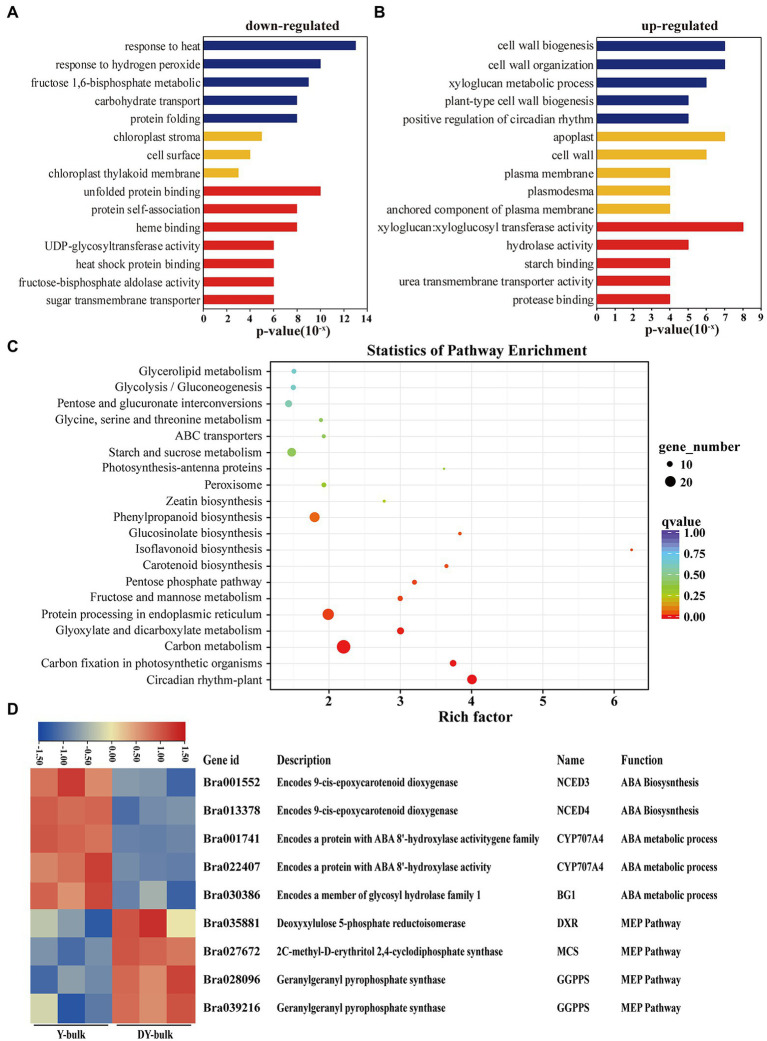
Figure 6.
Transcriptome analysis in yellow and dark yellow petals. (A,B) GO terms that were significantly enriched in 587 downregulated genes (A) and in 278 upregulated genes in the DY-bulk (B). (C) Scatter plot of top 20 enriched KEGG pathways. Rich factor is the ratio of the DEG number to the background number in a certain pathway. The size of the dots represents the number of genes, and the color of the dots represents the range of the q-value. (D) Differentially expressed genes related to the carotenoid metabolism and flux. The heatmap colors are shown in log2 (FPKM). Three biological replicates of the W-bulk and G-bulk are shown.

