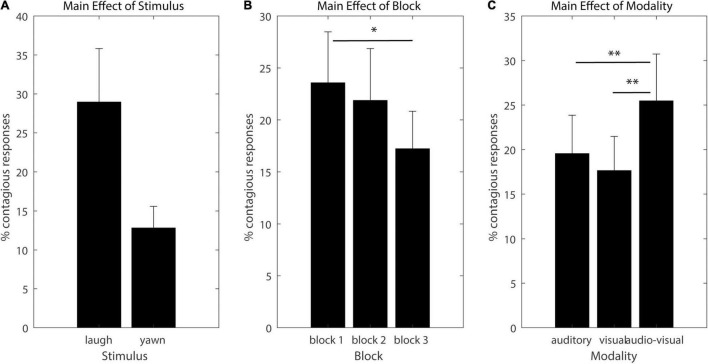
FIGURE 1.
Significant main effects. The y axis denotes the percentage of trials of contagious responses, bars denote marginal means for each condition and error bars denote standard errors. Significant linear contrasts (FDR corrected for multiple comparisons) are indicated by asterisks (*p < 0.05, **p < 0.01, and ***p < 0.001). (A) main effect of Stimulus, (B) main effect of Block, (C) main effect of Modality.

