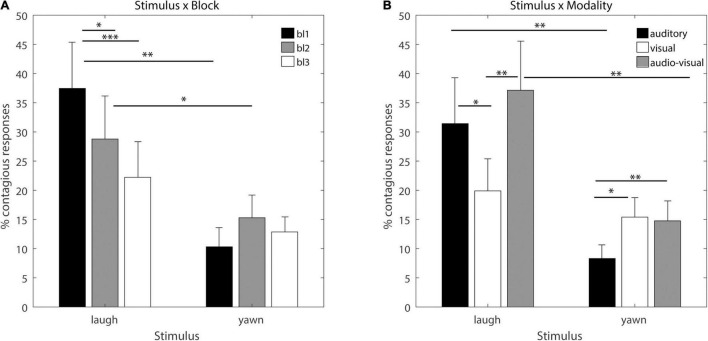
FIGURE 2.
Significant interactions. The y axis denotes the overall percentage of contagious responses, bars denote marginal means for each condition and error bars denote standard errors. Significant linear contrasts (FDR corrected for multiple comparisons) are indicated by asterisks (*p < 0.05, **p < 0.01, and ***p < 0.001). (A) Interaction between Stimulus × Block: contagious responses for laughter and yawning in the 1st (black bars) 2nd (gray bars) and 3rd (white bars) block. (B) Interaction between Stimulus × Block: contagious responses in the auditory (black bars), visual (white bars) and audio-visual (gray bars) modality for laughter and yawning.

