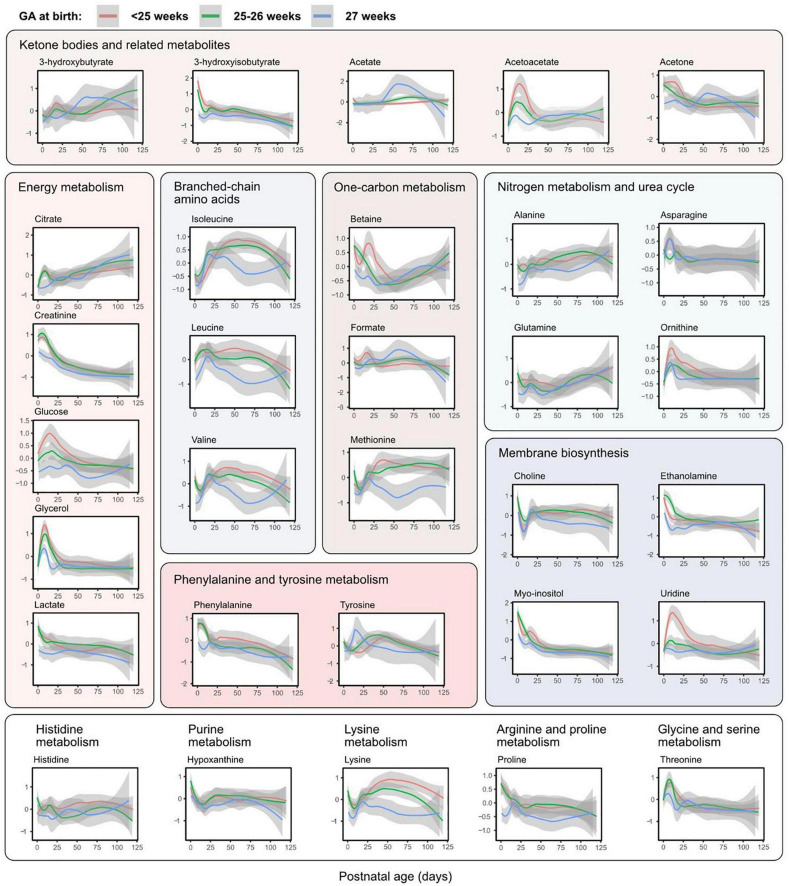
FIGURE 5.
Metabolite levels over postnatal age (days) by gestational age (GA) group. Accordingly to the legend, metabolite levels were stratified by GA at birth. Lines represent smoothed conditional means with 95% confidence intervals (shaded areas). Means are only shown up to day 120 due to few samples in each group at later time points. Y-axis shows z-score normalized metabolite abundances.

