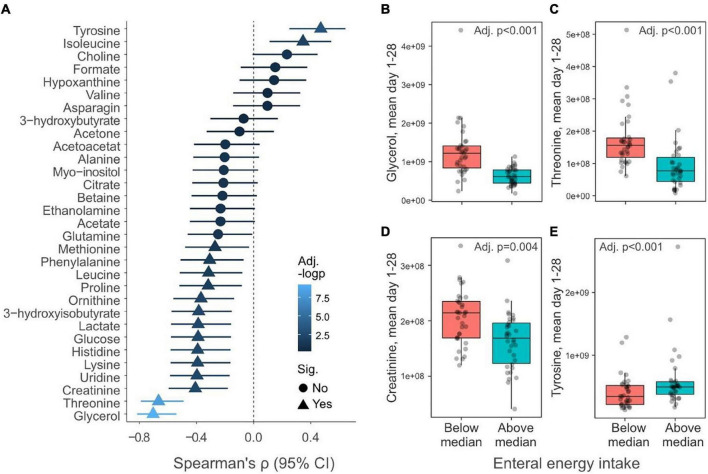
FIGURE 7.
Relationship between enteral nutrition and serum metabolites. (A) Spearman correlation (95% confidence interval) between energy provided as enteral nutrition day 1–28 and mean daily metabolite levels during the corresponding period (n = 69). Triangles indicate metabolites that significantly (p < 0.05) correlate with enteral energy intake and the color of the symbols reflect the negative logarithm of the p-value. (B–E) Boxplots show mean daily levels of selected metabolites that depend on the total energy provided as enteral energy. Infants have been dichotomously grouped if they received above (n = 34) or below (n = 35) the median amount of total energy as enteral energy day 1–28. Y-axis shows normalized NMR signal. p-values have been false discovery rate adjusted using the Benjamini–Hochberg method.

