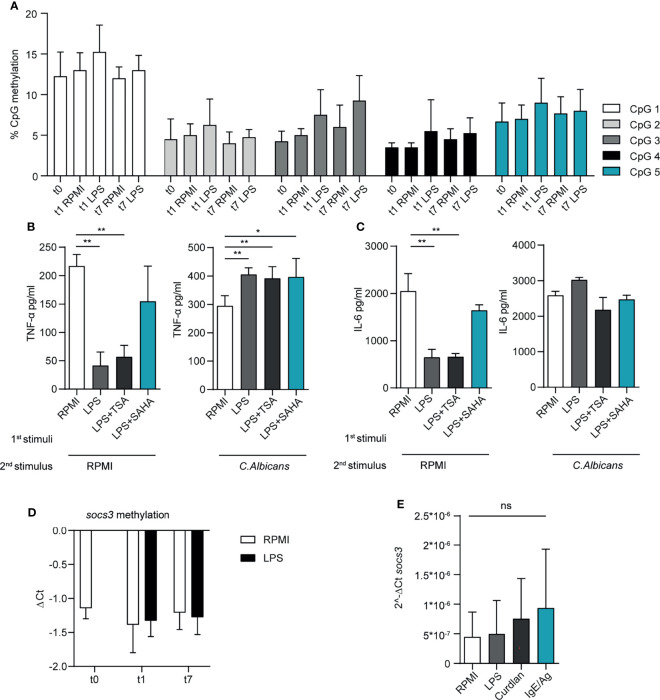
Figure 5.
LPS priming affects the epigenetic landscape in MCs. (A) CpG methylation at TNF-α promoter region. A total of five CpG sites were analysed in the selected region, their level of methylation was determined by pyrosequencing. Mean + SD of n=3-5 independent experiments are reported. BMMC were primed with LPS (1μg/ml) in presence of HDAC inhibitors (SAHA 1nM; TSA 10nM), then washed, re-stimulated and analysed for TNF-α (B) and IL-6 (C) secretion upon second stimulation with LPS or C. albicans. Mean + SD of n=3 independent experiments are reported. (D) SOCS3 promoter CpG methylation was determined by real-time MSP. Methylation was calculated as difference among Ct values of unmethylated and methylated region. Mean + SD of n=2-6 independent experiments are reported. (E) SOCS3 mRNA expression in BMMC at day 7, i.e. 6 days after the first stimulation with LPS, curdlan and IgE/Ag. Mean + SD of n=3 independent experiments are reported. Statistical analysis were performed with one-way Anova with Dunnet correction (*p < 0,05 **p < 0,01; ***p < 0,001 ns, not significant).

