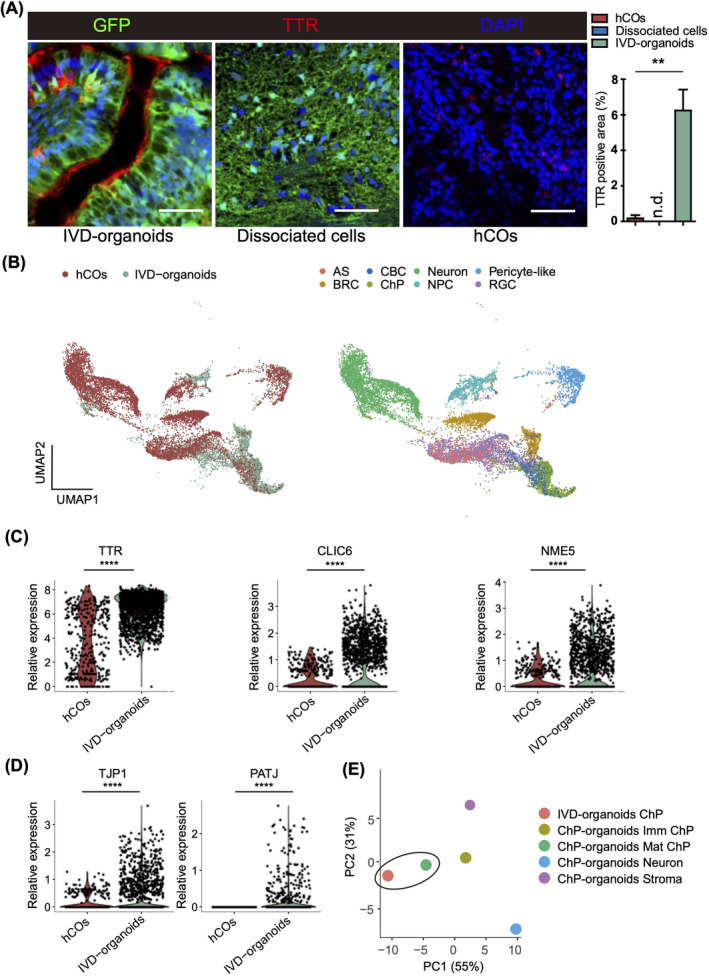
FIGURE 3.

ChP cells are efficiently generated in IVD‐organoids. (A) Immunostaining of TTR in IVD‐organoids, dissociated cells and day 60 hCOs. Scale bars, 50 μm. Quantification results are presented as mean ± s.e.m (n = 3 for transplanted mice, dissociated cells and cultured hCOs). (B) Integrated UMAP plots showing joint clustering of IVD‐organoids and hCOs. Colored by samples (left) and cell types (right). (C) Violin plots showing expression levels of mature ChP markers in hCOs and IVD‐organoids. (D) Violin plots showing expression levels of tight junction markers in hCOs and IVD‐organoids. (E) PCA analysis of the ChP cell cluster in IVD‐organoids and various cell clusters in ChP organoids
