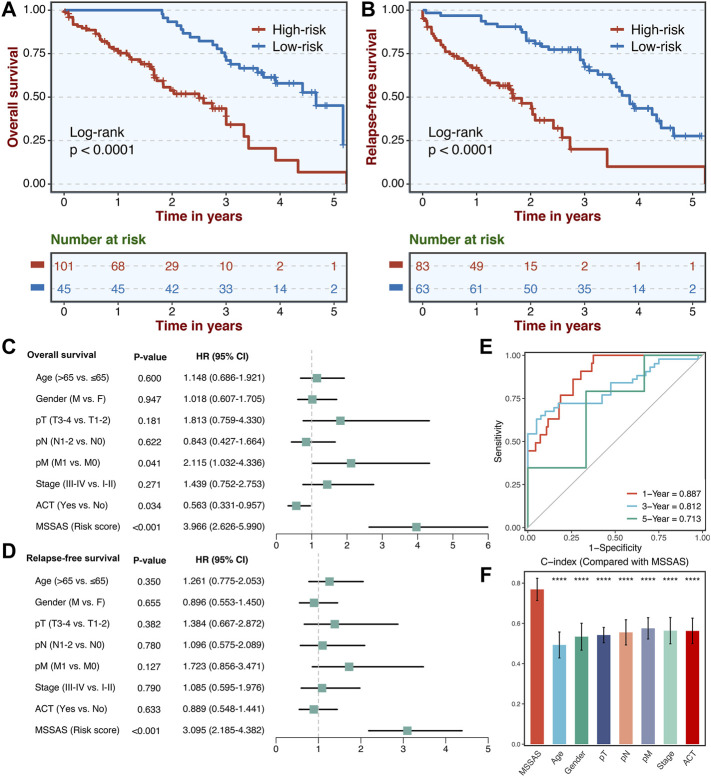
FIGURE 8.
Validation of MSSAS in our clinical cohort. Kaplan–Meier curves of OS (A) and RFS (B) according to the MSSAS. Multivariate Cox regression analysis of MSSAS for OS (C) and RFS (D). (E) Time-dependent ROC analysis for predicting OS at 1, 3, and 5 years. (F). The performance of MSSAS was compared with common clinical and molecular variables in predicting prognosis.

