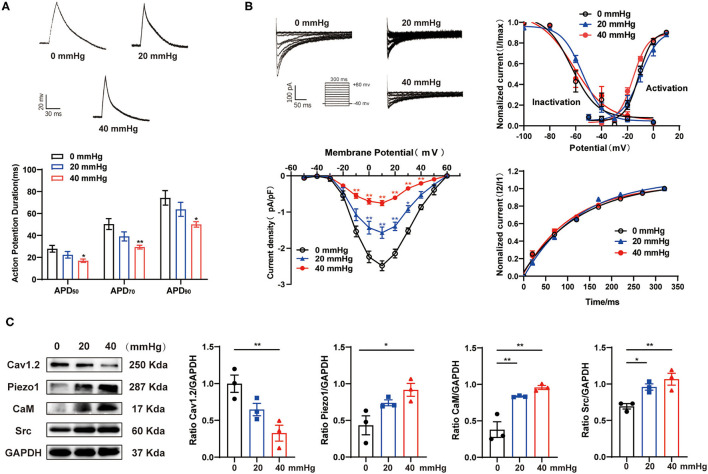
Figure 3.
Effect of HHP on the depression of ICa,L in HL-1 cells. (A) Representative traces of AP in HL-1 cells under various hydrostatic pressures (0, 20, and 40 mmHg) for 24 h. APD50, APD70, and APD90 of HL-1 cells were calculated (n = 9, 10, and 7 at 0, 20, and 40 mmHg, respectively). *p < 0.05, **p < 0.01 vs. 0 mmHg. (B) Representative traces (pulse protocol, inset), corresponding current-voltage relationship, mean data for voltage dependence activation, inactivation, and time course of recovery current for ICa,L (n = 8–18 at 0, 20, and 40 mmHg, respectively). *p < 0.05, **p < 0.01 vs. 0 mmHg. (C) Representative western blots and densitometric analysis of Cav1.2, Piezo1, CaM, and Src in HL-1 cells under various hydrostatic pressure (0, 20, and 40 mmHg) for 24 h. GAPDH was used as an internal control. Values are presented as the mean ± SEM.

