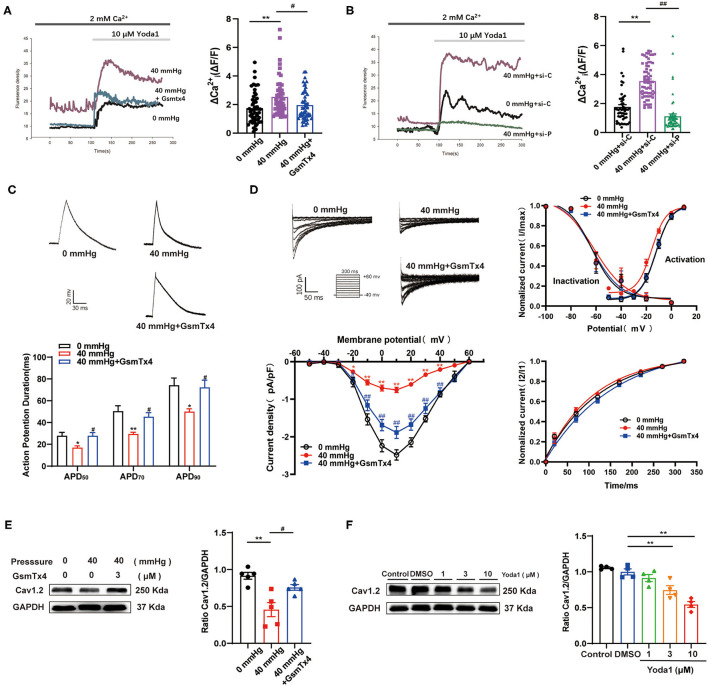
Figure 4.
The effects of Piezo1 on perceiving HHP and mediating the decrease of ICa,L. (A,B) Representative Ca2+ traces and Δ(ΔF/F) are shown. Ca2+ entry was evoked by 10 μm Yoda1 in HL-1 cells stimulated by HHP in the presence or absence of the Piezo1 inhibitor GsmTx4 (n = 50) or siRNA specifically knockdown Piezo1 (n = 53–58). si-C, scrambled (control) siRNA; si-P, siRNA directed against Piezo1. (C) Representative traces of AP in HL-1 cells stimulated by 40 mmHg pressure with and without GsmTx4 treatment (3.0 μM) and APD50, APD70, and APD90 of HL-1 cells were calculated (n = 9, 7, and 11 at 0, 40, and 40 mmHg + GsmTx4). *p < 0.05, **p < 0.01 vs. 0 mmHg; #p < 0.05 vs. 40 mmHg. (D) Representative traces (pulse protocol, inset), corresponding current–voltage relationship, mean data for voltage dependence activation, inactivation, and time course of recovery current for ICa,L in HL-1 cells stimulated by 40 mmHg pressure with and without GsmTx4 treatment (n = 9–15). **p < 0.01 vs. 0 mmHg; ##p < 0.01 vs. 40 mmHg. (E) Representative blots and densitometry analysis of Cav1.2 in HL-1 cells stimulated by 40 mmHg pressure with and without GsmTx4 treatment. (F) Representative blots and densitometry analysis of Cav1.2 in Yoda1 stimulation at different dosages (1, 3, and 10 μM) for 48 h. GAPDH was used as an internal control. Values are presented as the mean ± SEM.

