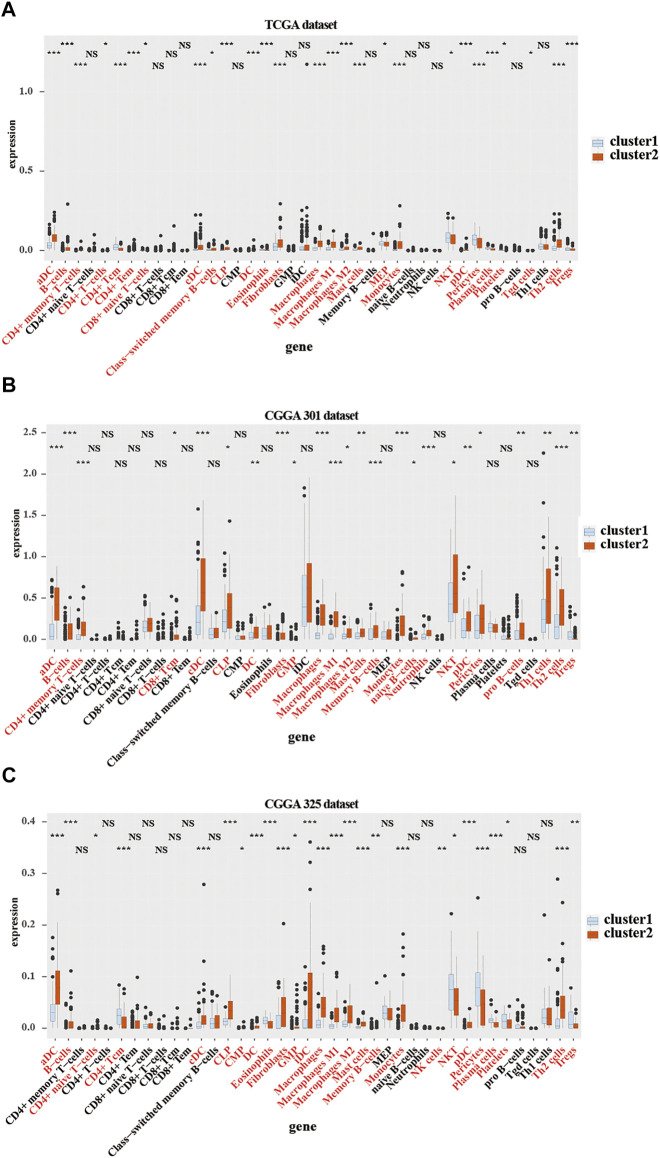
FIGURE 4.
Immune cells infiltration in cluster 1 and cluster 2 from TCGA and CGGA301 databases. xCELL algorithm of infiltrated immune cells in cluster 1 and cluster 2 from TCGA (A), CGGA301 (B), and CGGA301 (C) databases. The Wilcox test was used to compare the difference between the two groups (ns: no significant differences, *p < 0.05, **p < 0.01, and ***p < 0.001).

