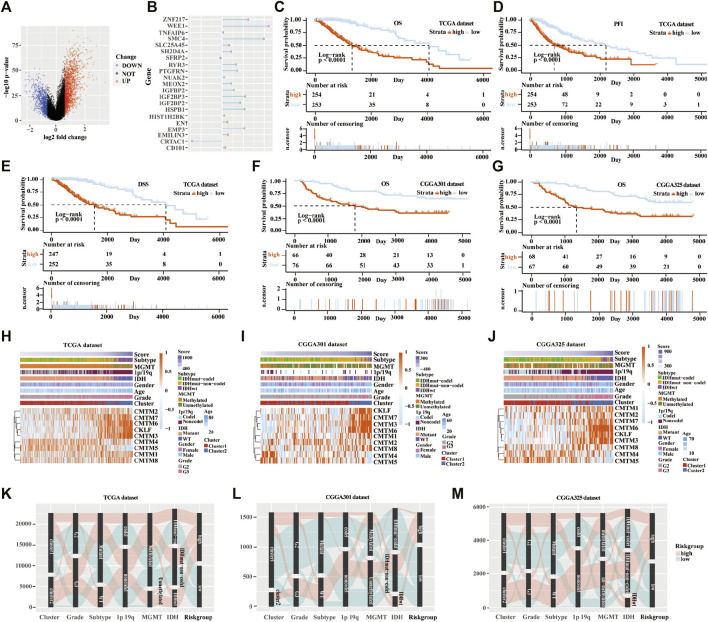
FIGURE 6.
Establishment and verification of the scoring model in the training and validation cohorts. (A) Volcano plot of differently expressed genes in the two clusters from TCGA database. (B) Elastic network map of 21 genes that were associated with prognosis in the two clusters from the TCGA database. Kaplan-Meier analysis of patients in low-risk and high-risk groups from the TCGA database for OS (C), PFI (D), and DSS (E). (F) Kaplan-Meier analysis of patients in low-risk and high-risk groups from the CGGA301 database for OS. (G) Kaplan-Meier analysis of patients in low-risk and high-risk groups from the CGGA325 database for OS. Heatmap of different glioma features and expression of CMTM in the low-risk and high-risk groups from the TCGA (H), CGGA301 (I), and CGGA325 (J) databases. Sankey diagram of different expression patterns of glioma features in cluster 1 and cluster 2 from TCGA (K), CGGA301 (L), and CGGA325 (M) databases, analyzed by the log-rank test.

