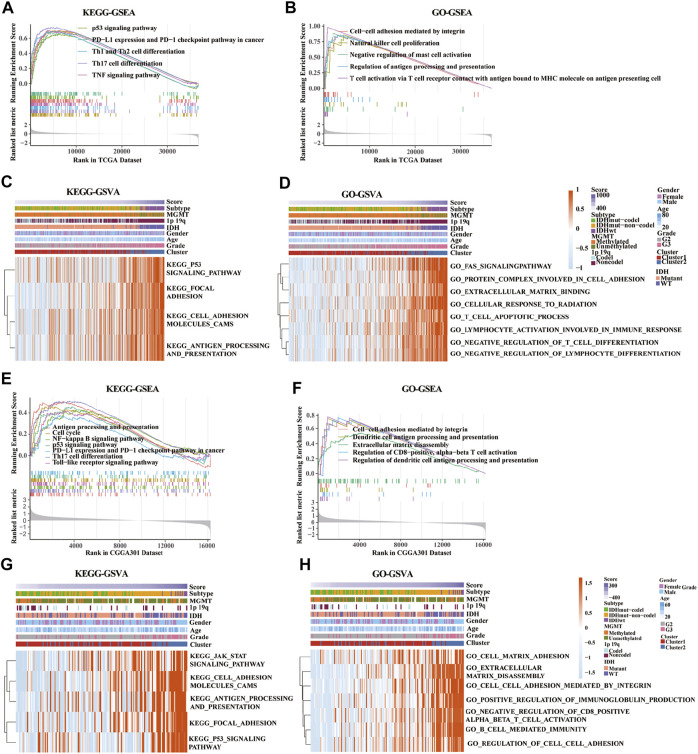
FIGURE 7.
Gene set enrichment analysis (GSEA) and gene set variation analysis (GSVA) of key pathways between low-risk and high-risk groups based on gene ontology (GO) and Kyoto Encyclopedia of Genes and Genomes (KEGG) databases. (A,E) Enriched pathways between low-risk and high-risk groups based on KEGG-based GSEA analysis in TCGA (A) and CGGA301 (E) databases. (B,F) Enriched pathways between low-risk and high-risk groups based on GO-based GSEA analysis in TCGA (B) and CGGA301 (F) databases. (C,G) Enriched pathways between low-risk and high-risk groups based on KEGG-based GSVA analysis in TCGA (C) and CGGA301 (G) databases. (D,H) Enriched pathways between low-risk and high-risk groups based on GO-based GSVA analysis in TCGA (D) and CGGA301 (H) databases.

