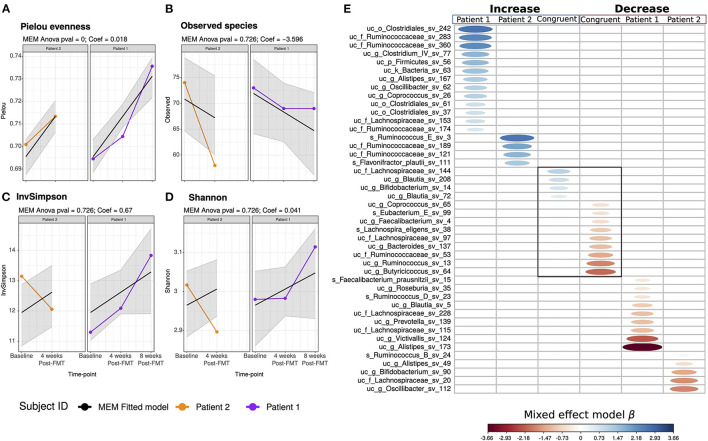
Figure 3.
Patients' microbiome diversity. Mixed-effects models (MEM) of the genus level (A) Pielou evenness, (B) observed species, (C) inverse simpson, and (D) Shannon index, the alpha diversity estimators were modeled into a discrete manner and represent its results as boxplot and into a continuous way, representing the MEM slope into line-plots. The gray area into the continuous MEM represents the 95% confidence level. Patient 1 is displayed in purple, patient 2 in orange. (E) Mixed-effects models (MEM) of the ASV after the FMT intervention. The columns remarked in blue indicates the increase in the abundance of the ASV of patient 1, patient 2, and when the increase is congruent between both. Similarly, the columns remarked in blue indicates the decrease of the ASV in time. The blue scale represents the MEM positive coefficient; in red, the negative. The ASV was set as a putative biomarker if both the continuous and discrete mixed-effect-model time coefficients were significant (ANOVA < 0.05).

