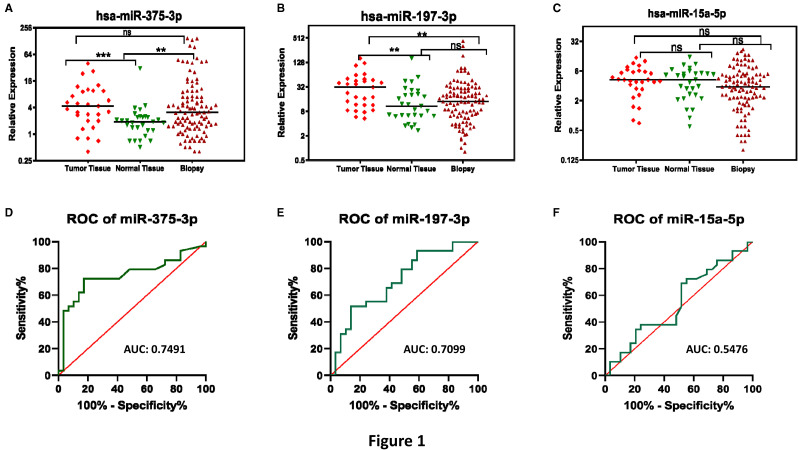
Figure 1.
The expression of miR-375-3p and miR-197-3p is upregulated in lung tumors. The column scatter plots showing relative expression of (A) miR-375-3p, (B) miR-197-3p, and (C) miR-15a-5p in surgically resected lung tumors (n = 29), paired adjacent normal lung tissue samples (n = 29), and tissue biopsies (n = 103) of lung cancer patients. ROC curves were generated to assess the diagnostic potential of (D) miR-375-3p, (E) miR-197-3p, and (F) miR-15a-5p for lung cancer (tumor vs paired normal lung tissue). The expression of the miRNAs mentioned above was measured by TaqMan advanced miRNA assays (Thermo Fisher Scientific) and was normalized with that of miR-423-5p expression. ** P < .001; *** P < .0001; ns: not significant; AUC: area under the receiver operating characteristic curve.

