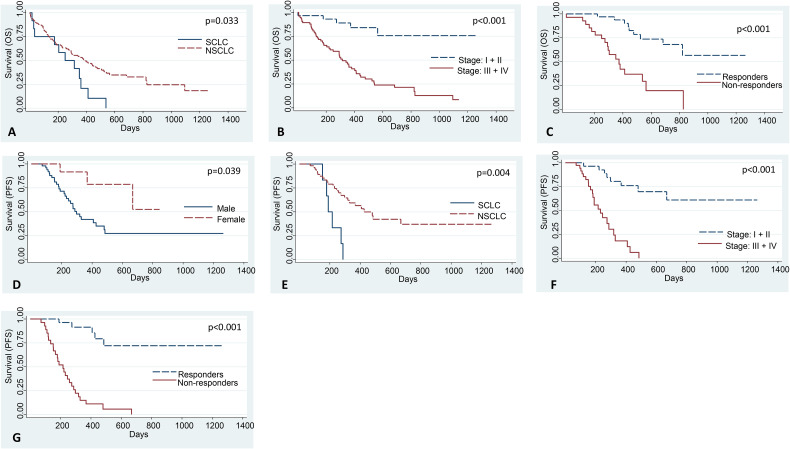
Figure 3.
The correlation of various clinicopathological parameters with OS and PFS of lung cancer patients. Kaplan-Meier curves for correlating (A) histology, (B) stage, and (C) response to therapy with OS of lung cancer patients. Lung cancer patients of NSCLC histology, stages I and II disease, and those who responded to the therapy have significantly better OS than those with SCLC, stages III and IV disease, and nonresponders, respectively. Kaplan-Meier curves for correlating (D) gender, (E) histology, (F) stage, and (G) response to therapy with PFS of lung cancer patients. Lung cancer patients of the female gender, NSCLC histology, stages I and II disease, and those who responded to the therapy have significantly better PFS than those with male gender, SCLC, stages III and IV disease, and nonresponders, respectively.

