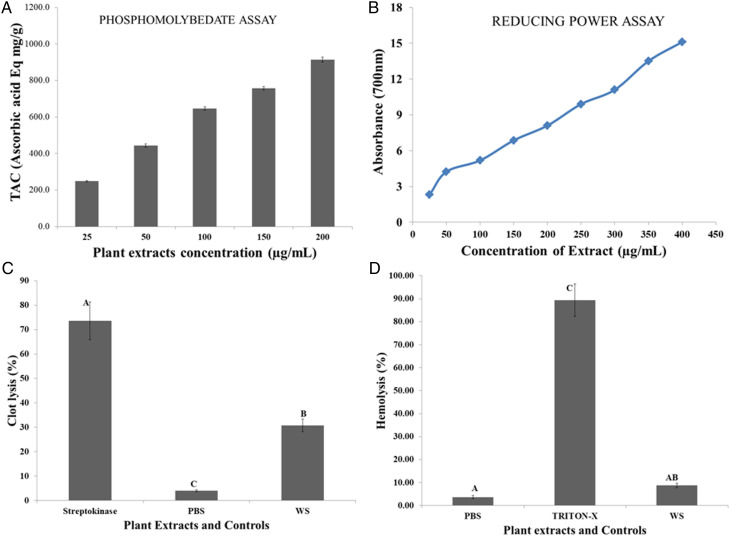
Figure 3.
Graphical representation of (A) total antioxidant capacity (TAC) by phosphomolybdenum method. (B) Reducing potential investigated by FRAP (C). Thrombolytic activities (%) of selected medicinal plant. (D) Hemolytic activity (%)evaluated against washed RBCs. Results are mean ± SEM of multiple determinations and controls. Different alphabets on the bars represent significance (P<.05) differences among tested plant extract and controls. WS= Withania somnifera.

