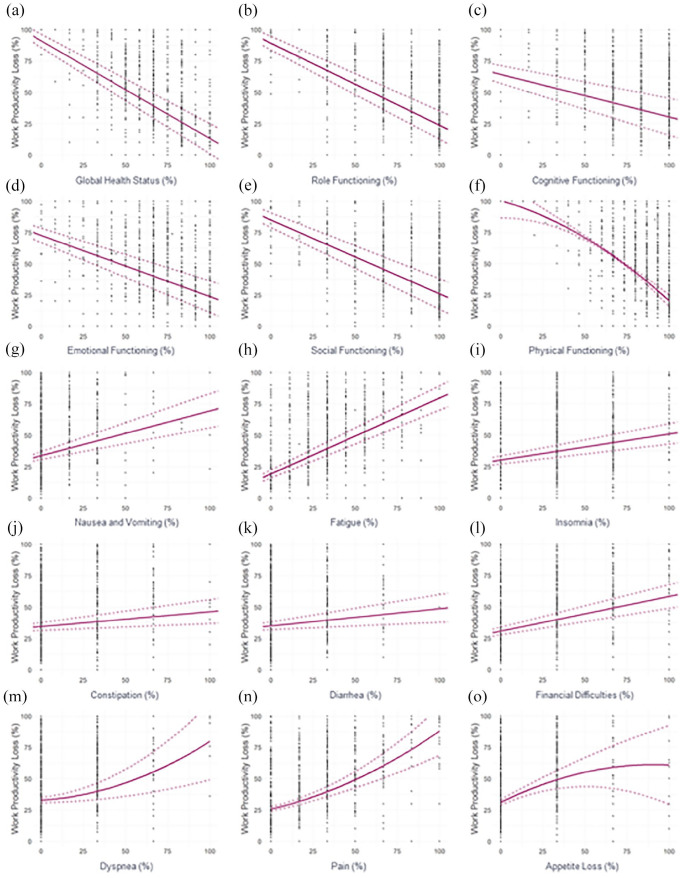
Figure 1.
Univariable regression plots showing WPL (%) in relation to the EORTC QLQ-C30 functional (a–f) and symptomatic (g–o) domain scores (%) in the ITT population. EORTC QLQ-C30, European Organisation for Research and Treatment of Cancer Quality of Life questionnaire; ITT, intent to treat; WPL, work productivity loss.

