Figure 5.
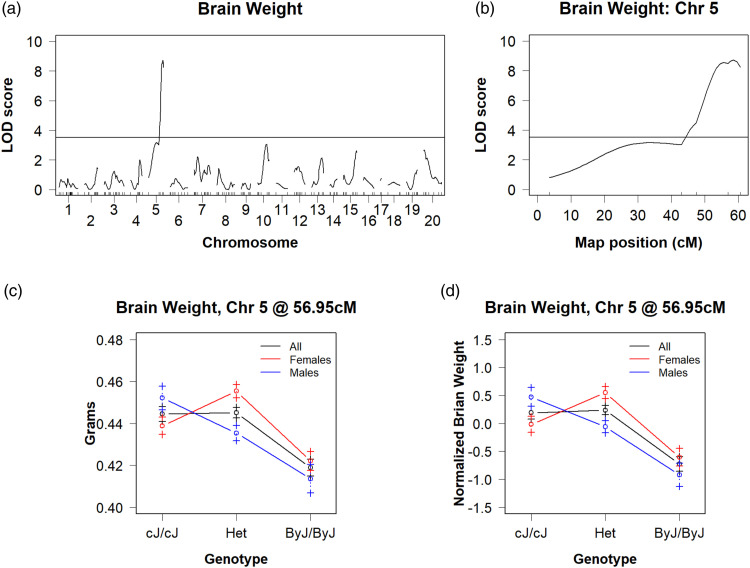
A BALB/c reduced complexity cross identifies a genome-wide significant QTL on chromosome 5 for brain weight (a): Genome-wide significant QTLs were identified on chromosome 5 (LOD = 8.73, p < 0.001; 12% of the variance explained). (b): QTL plot for the chromosome 5 QTL that peaks at 59 cM (118 Mb). (c): Chromosome 5 effect plot at the peak-associated marker recapitulates both the direction and magnitude of the original parental substrain difference shown in Figure 2. (d): Chromosome 5 effect plot at the peak-associated marker for normalized brain weight recapitulates observed trend in non-normalized data.

