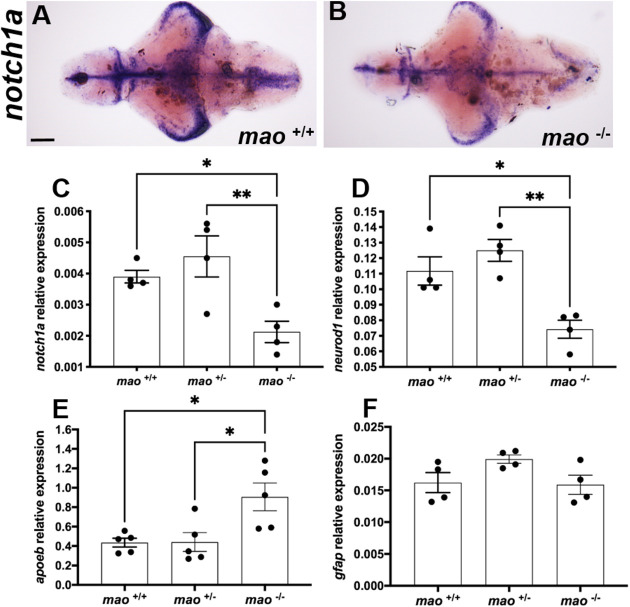
Fig. 4.
mao−/− larvae exhibit altered expression of developmental markers. (A,B) Ventral views of whole-mount 10 dpf mao+/+ (A) and mao−/− (B) larval brains, anterior to the left, processed for notch1a RNA ISH. n=4 for each genotype. (C-F) Bar charts showing results from RT-qPCR analysis of notch1a (C), neurod1 (D), apoeb (E) and gfap (F) in larvae of the indicated genotype at 10 dpf. n=4 for each genotype. Data are mean±s.e.m. One-way ANOVA followed by Tukey's multiple comparisons test for statistical analysis. *P<0.05, **P<0.01. Scale bar: 75 μm.

