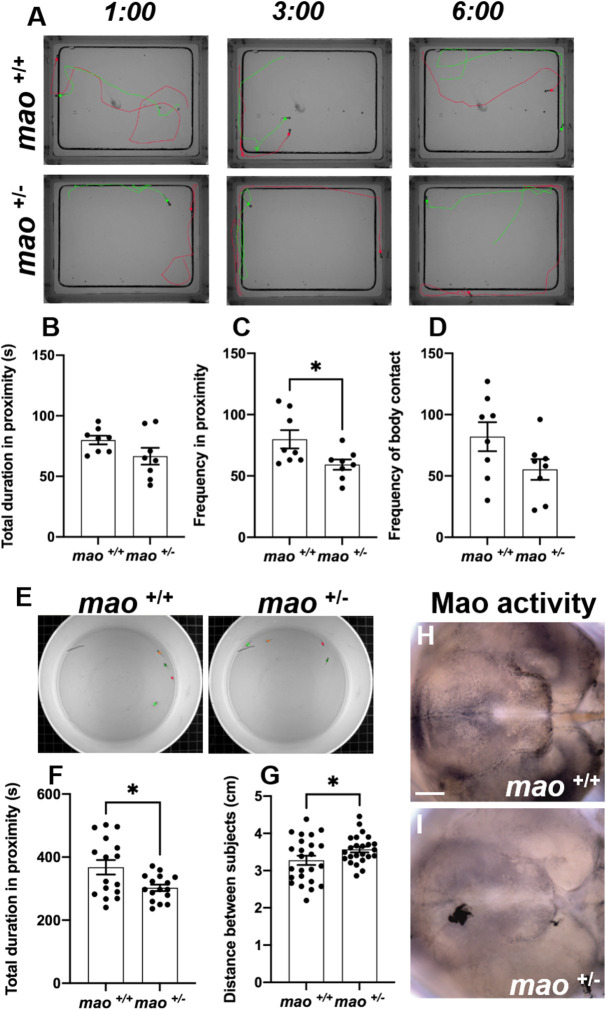
Fig. 5.
Social cohesion of mao+/− juvenile fish is impaired. (A) Representative images of three different time points during the social contact behavior of mao+/+ and mao+/− fish at 30 dpf. n=8 for each genotype. (B,C) Bar charts showing total duration (B) and frequency (C) in proximity to other fish for the indicated genotypes. (D) Bar charts showing frequency of body contact for the indicated genotypes. (E) Representative images of 40 dpf mao+/+ and mao+/− fish during the shoaling behavior evaluation. n=4 for each genotype. (F) Bar charts showing total duration in proximity to other fish during shoaling behavior for the indicated genotypes. (G) Bar charts showing average distance between fish of the indicated genotype during shoaling behavior. (H,I) Ventral views of whole-mount 40 dpf mao+/+ (H) and mao−/− (I) brains, anterior to the left, processed for Mao activity. mao+/− fish show weaker Mao activity after shoaling behavior. n=4 for each genotype. Data are mean±s.e.m. Unpaired, two-tailed Student's t-test was used for statistical analysis. *P<0.05. Scale bar: 75 μm.

