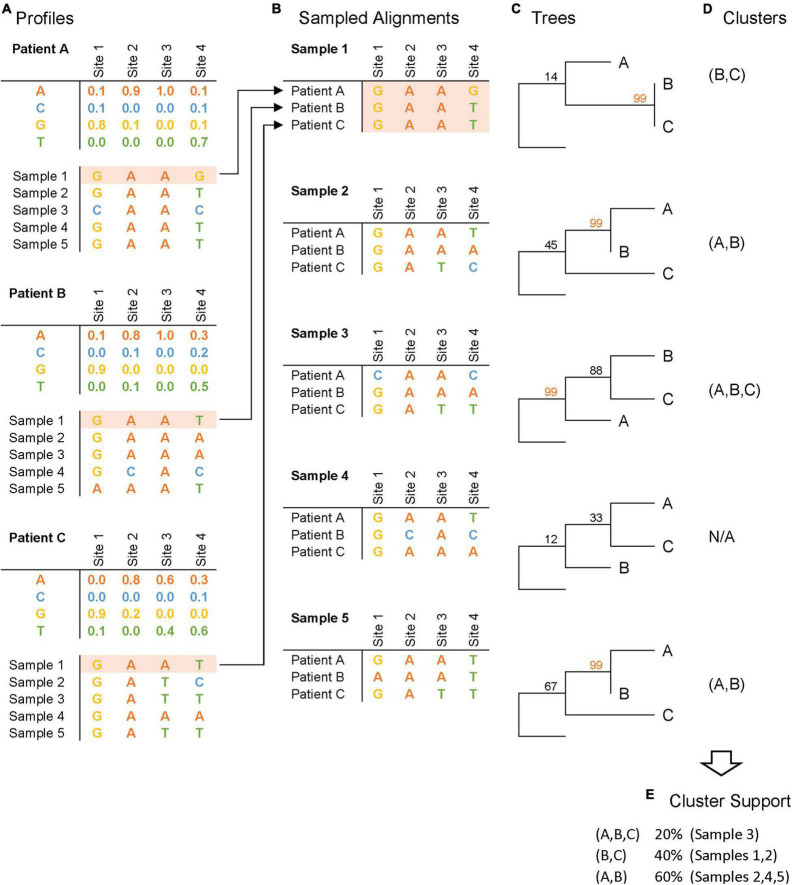
FIGURE 1.
Profile sampling pipeline. This schematic figure depicts the four steps of the profile sampling process, illustrated here with 5 samples per patient: (A) NGS-derived frequencies at each HIV genome site for each patient are generated, and synthetic sequences are sampled from these frequency tables to summarize intra-host variation; (B) sampled sequences are collated across patients to construct sampled alignments; (C) phylogenetic trees are inferred with bootstrap support from the alignments; (D) clusters are inferred based on phylogenetic bootstrap support (illustrated here with bootstrap support ≥ 99); and (E) cluster support is measured as the frequency that a cluster is inferred across samples.

