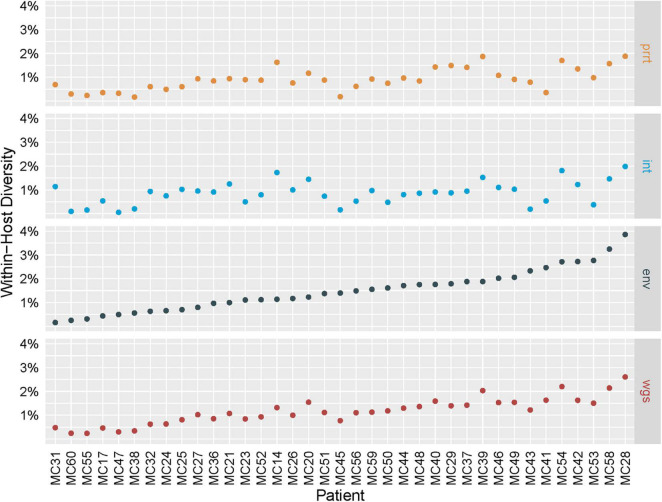
FIGURE 2.
Intra-host genetic diversity by genomic region. Intra-host genetic diversity (Y axis; defined as the average percent difference across all pairwise comparisons of the 500 profile-sampled nucleotide sequences for an individual) of the four examined genomic regions (gray boxes on the right) in the 37 sampled individuals (X axis) is highest in env for most individuals and lies within the range of previously reported values.

