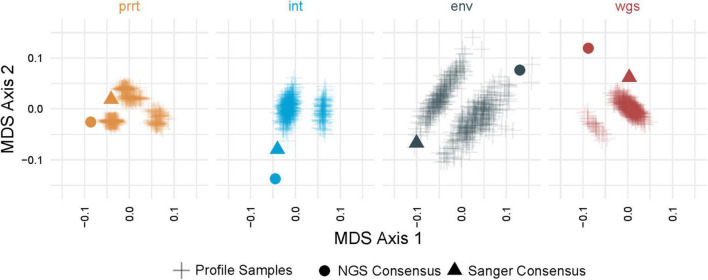
FIGURE 3.
Multi-dimensional scaling (MDS) of pairwise geodesic distance among maximum-likelihood phylogenies from the profile sampling approach within genomic regions. MDS Axis 1 (X axis) and Axis 2 (Y axis) show that the space of inferred phylogenies is multi-modal for all genomic regions. The phylogenies from NGS and Sanger consensus sequences (dot and triangle) are point estimates that do not capture the full variation in phylogenies that can be inferred from deeply-sequenced NGS data (plus signs) in all examined genomic regions (colors).

