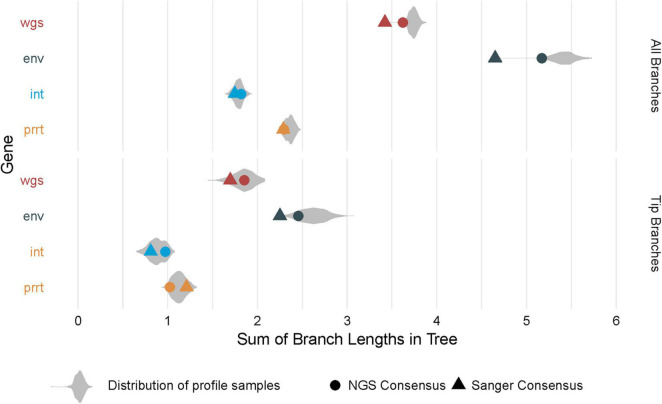
FIGURE 5.
Distribution of branch length sums across phylogenies. The figure demonstrates total branch lengths (X axis), in each of the profile-sampled phylogenies (Y axis and colors). The phylogenies from consensus sequences (dot and triangle) can lie at extreme values within these distributions, both when considering the lengths across all branches (top) and the lengths across only the branches at the tips (bottom).

