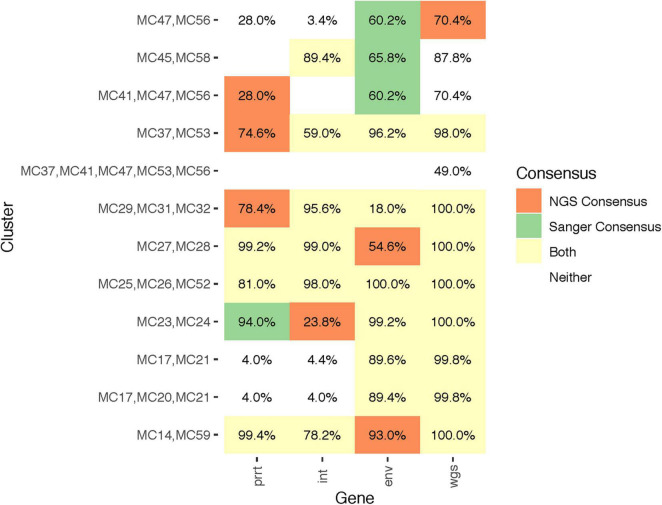
FIGURE 6.
Quantitative differences in profile-sampled cluster support across genomic regions. The figure illustrates the clusters and their subclusters (Y axis) identified by Sanger versus NGS consensus sequences (colors; see legend) across genomic regions (X axis). Numeric values indicate cluster support from the profile sampling method. A blank cell indicates that the cluster was not detected in that genomic region.

