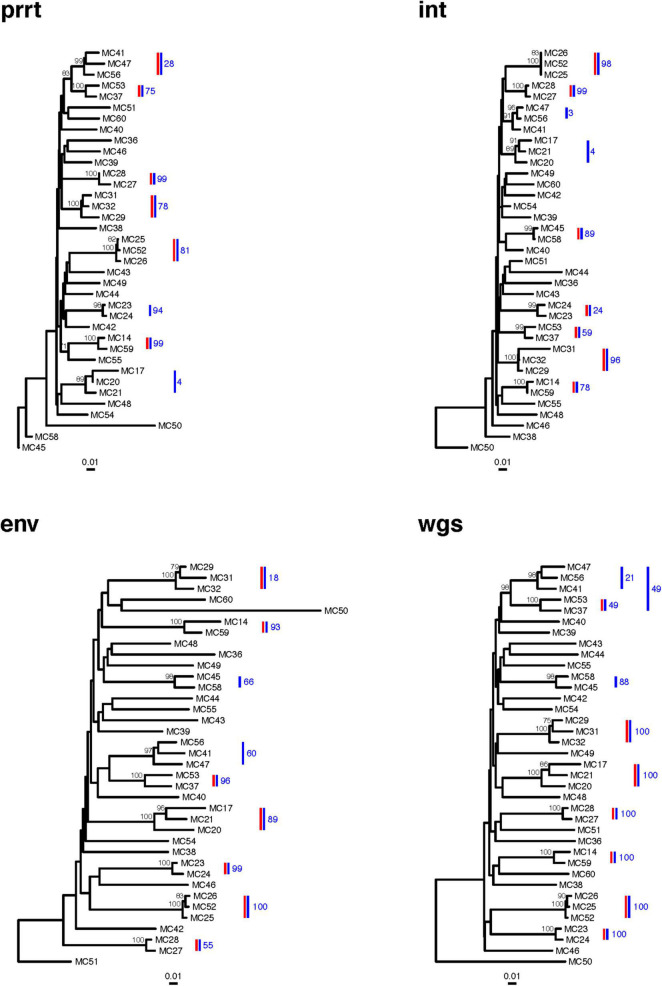
FIGURE 7.
Next-generation sequencing (NGS) consensus sequence phylogenetic trees of 37 new HIV diagnoses in RI according to genomic region. The figure demonstrates clusters in phylogenetic trees from four genomic regions (prrt-protease reverse transcriptase; int-integrase; env-envelope; wgs-whole genome sequence). Clusters (≥99% bootstrap support) inferred from the phylogenies of NGS consensus sequences (vertical red bars) differ across genomic regions. The largest number of clusters was inferred from int, env, and wgs, and the smallest number from prrt. Profile sampling detected additional clusters (vertical blue bars) and provided a bootstrap-like measure of cluster support (annotation to blue bars). Bootstraps > 70% are shown to the left of the relevant node. Trees are rooted by an HIV-1 group O sequence, which is omitted from the plots.

