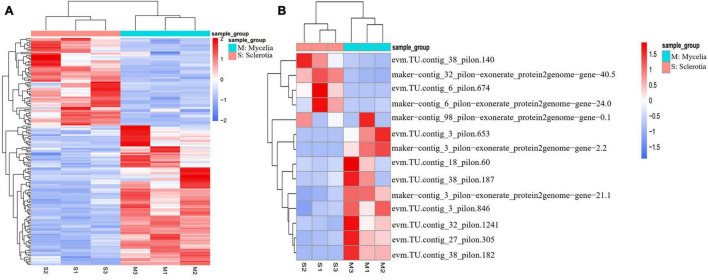
FIGURE 5.
Heat map demonstration of expression patterns analysis in DEGs (p value < 0.05, | log2Fold Change| > 1) between sclerotia and mycelia using the FPKM. (A) Genes involved in oxidation-reduction progress show significant different expression in GO-BP. (B) Hydrophobins had more significant differential expression in sclerotia than in mycelia.

