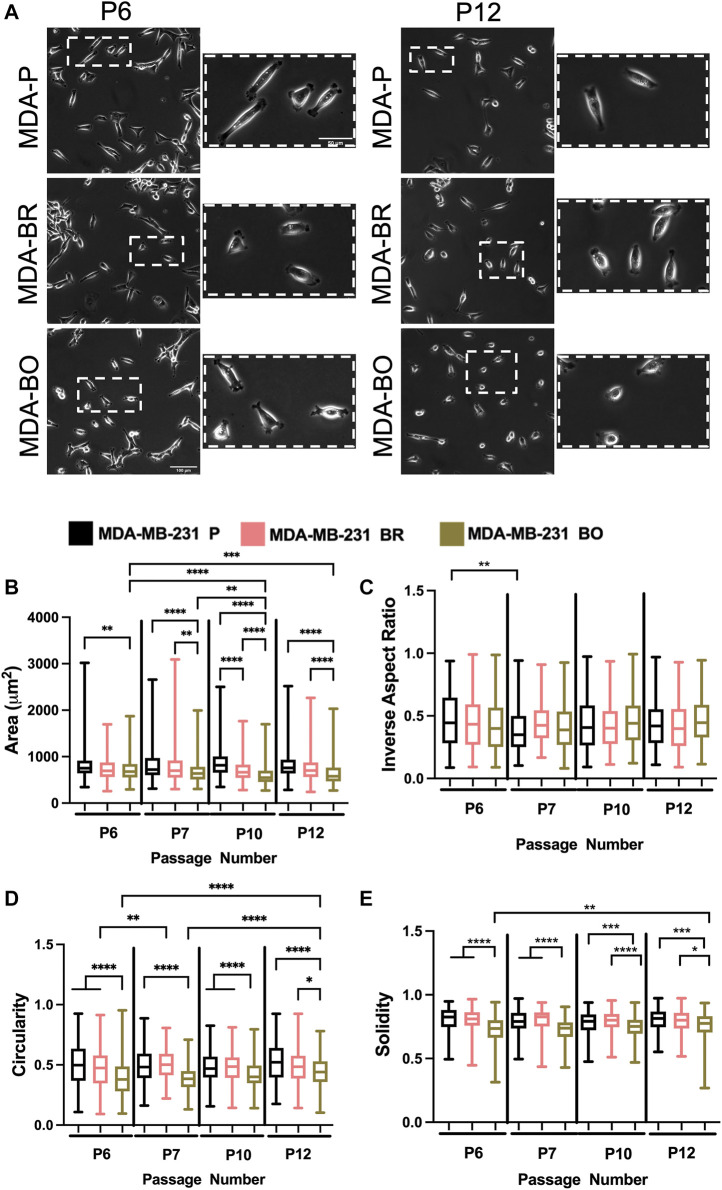
FIGURE 2.
Effects of passage number on cell morphology. (A) Phase contrast images of MDA-P, MDA-BR, and MDA-BO cells at Passage 6 (P6) and Passage 12 (P12). Scale bars represent 100 μm (in zoomed out images) or 50 μm (in zoomed insets). Also shown are quantification of cell (B) area, (C) inverse aspect ratio, (D) circularity, and (E) solidity as a function of passage number. Box and whisker plots represent the minimum and maximum data points, the median, and the interquartile range. * indicates p < 0.05. ** indicates p < 0.01. *** indicates p < 0.001. **** indicates p < 0.0001. Each column of data is from N > 190 cells pooled from at least 3 independent experiments. The data were tested for normality using the D’Agostino and Pearson test. Data for area, inverse aspect ratio, and solidity did not follow a normal distribution, and hence a Kruskal Wallis test and a Dunn’s multiple comparison test were performed to determine significance for those data. Data for circularity partially followed a normal distribution, and hence a two-way ANOVA, and multiple comparison test was performed to determine significance for that data set.

