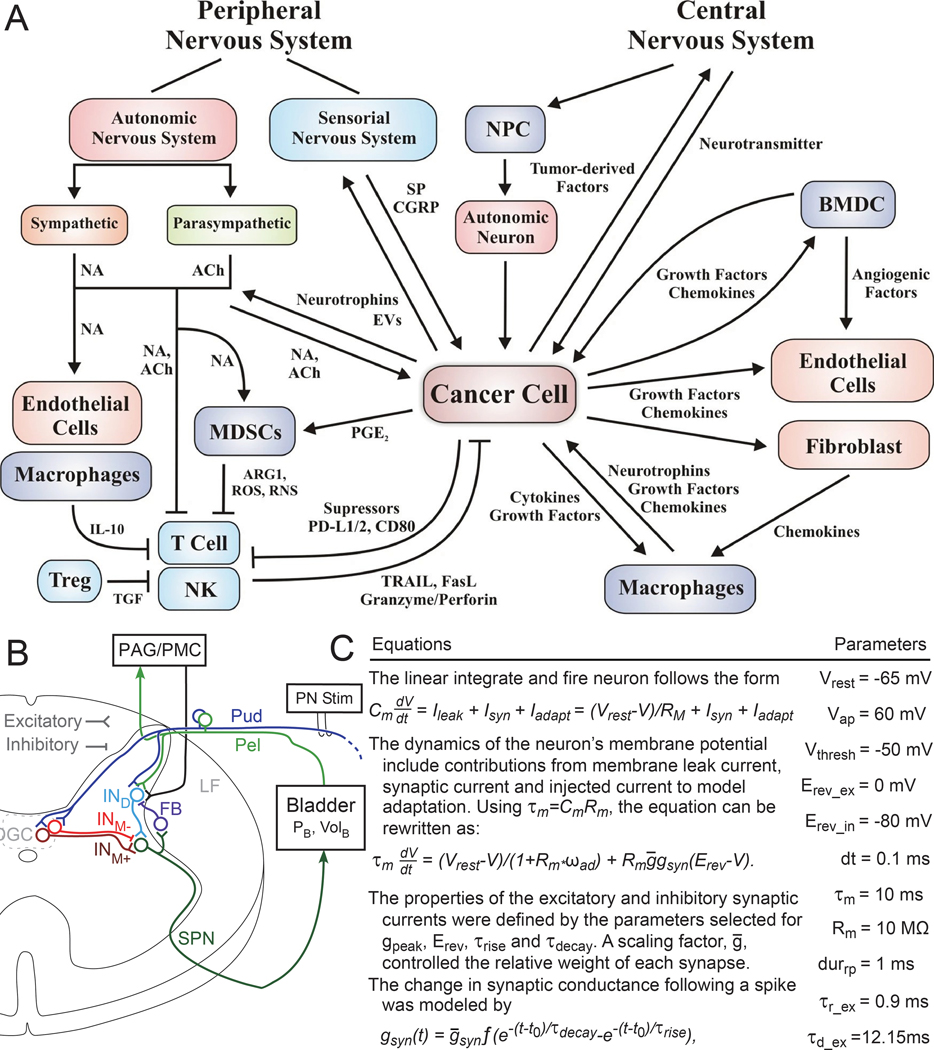
Figure 2:
Systems Diagrams and Computational Models. A) Example systems diagram demonstrating communication networks between a cancer cell and neuro-immune-vascular systems (17)(reproduced with permission). Such diagrams provide a place for integrating knowledge and identifying knowledge gaps. B) Another example diagram showing neural connections in the cat spinal cord(18)(reproduced with permission). In the original manuscript the connections in the diagram are modeled using linear integrate and fire neurons. Some of the equations and parameters used are shown in (C). This computational model was used to explore how the bladder responds to different stimulation patterns delivered on the pudendal (Pud) nerve. Additional details are available in the original text. Computational models are lacking and underutilized in this field.

