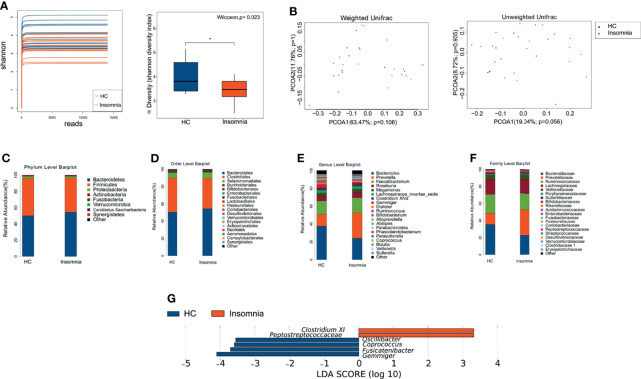
Figure 1.
Patients with insomnia showed differential gut microbial profiles compared with healthy controls. (A) α-diversity of Shannon index between insomnia and healthy control groups. *p < 0.05. (B) Plots of weighted and unweighted UniFrac PCoA of all samples. Orange dots: healthy controls; blue dots: insomnia patients. (C–F) Bar graphs of relative abundance of gut bacteria in healthy controls (A) and insomnia patients (B) at the levels of phylum, order, family, and genus. (G) Bar graphs of LEfSe analysis. Orange and blue bars represent the impact degree of enrichment of certain taxa in the healthy controls and insomnia patients, respectively. The LEfSe score threshold was 3 or -3. PCoA, principal coordinates analysis; LEfSe, linear-discriminant-analysis-effect-size; LDA, linear discriminant analysis; HC, Healthy control.

