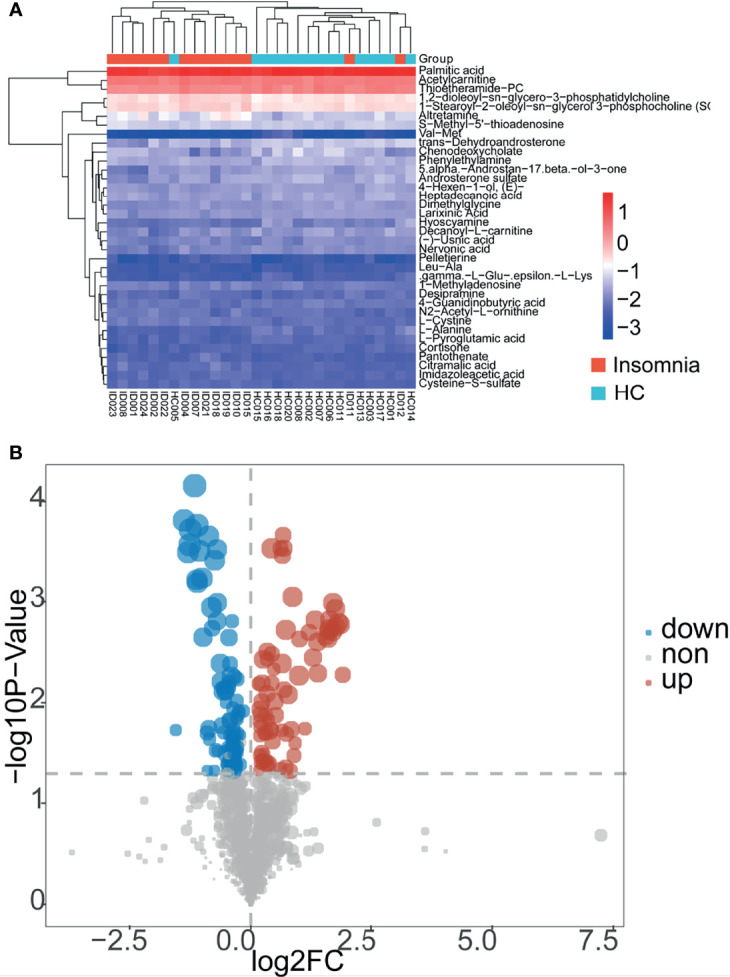
Figure 2.

Patients with insomnia showed differential serum metabolic profiles compared with healthy controls. (A) A heatmap of metabolites with significantly altered concentrations between insomnia and healthy control groups. Red and blue represent increased and decreased metabolites, respectively, in patients with insomnia compared with those in healthy controls. (B) A dot plot of metabolites in the serum samples of the participants. Blue and red dots represent significantly decreased and increased metabolites in the serum samples of insomnia patients compared with those of healthy controls. Gray dots represent nonsignificantly changed metabolites.
