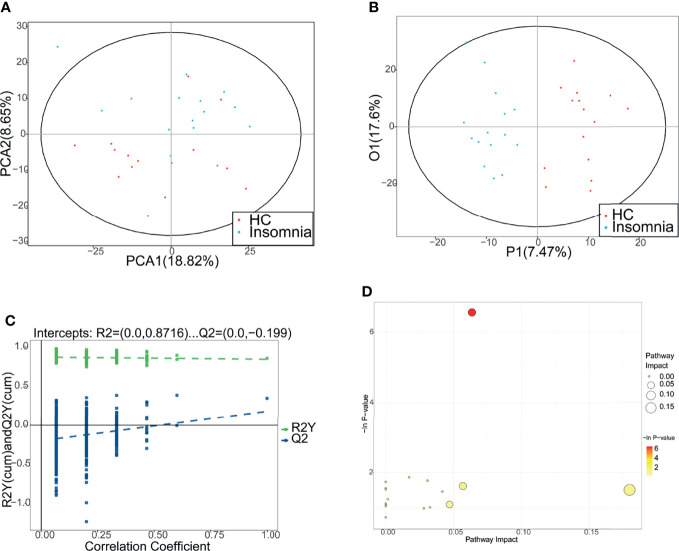
Figure 5.
Distinguishment between patients with insomnia and healthy controls using metabolic profiles. (A, B) Principal component analysis and orthogona projections to latent structures discriminant analysis (OPLS-DA) were performed to separate patients with insomnia and healthy controls using the metabolic profiles. Red: healthy controls. Blue: patients with insomnia. (C) The permutation test of OPLS-DA. (D) The metabolic pathway topology analysis. The horizontal axis indicates the −ln(p) values. The vertical axis indicates the impact values. PCA, principal component analysis; P1, 1st predictive principal component; O1, 1st orthogonal principal component.

