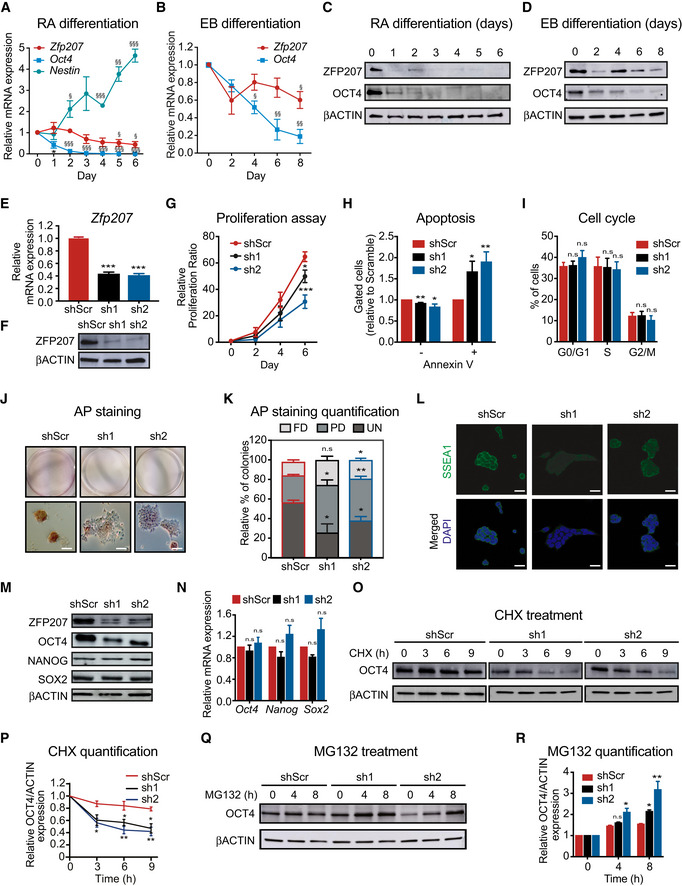
Figure 1. Depletion of Zfp207 leads to growth defects of mouse ESCs.

-
A, BRT‐qPCR analysis of Zfp207 and Oct4 in mouse ESCs during (A) retinoic acid (RA)‐induced and (B) embryoid body (EB)‐mediated differentiation. Nestin was used as a neuronal differentiation marker to monitor RA‐mediated differentiation. mRNA levels are relative to the expression at day 0.
-
C, DWestern blot of ZFP207 and OCT4 of mouse ESCs during (C) RA‐induced and (D) EB‐mediated differentiation.
-
E, F(E) RT‐qPCR and (F) western blot to monitor the knockdown efficiency of Zfp207 (sh1 and sh2).
-
GCell proliferation rate of shScr, sh1, and sh2 ESCs assessed over a period of 6 days.
-
HPercentage of live (Annexin V−) and apoptotic cells (Annexin V+) in sh1 and sh2 mouse ESCs compared to shScr.
-
IBar chart displaying the cell cycle distribution in sh1 and sh2 mouse ESCs relative to shScr.
-
J, K(J) AP staining of shScr and Zfp207‐depleted (sh1 and sh2) mouse ESCs. Scale bars, 20 µM. (K) Percentage of fully differentiated (FD), partially differentiated (PD) and undifferentiated (UN) ESC colonies in shScr, sh1 and sh2.
-
LImmunofluorescence analysis of SSEA1 in shScr, sh1, and sh2 ESCs. DAPI was used as the nuclear marker. Scale bars, 20 μm.
-
M, N(M) Western blot of ZFP207, OCT4, NANOG, and SOX2 in shScr, sh1 and sh2 ESCs and (N) RT‐qPCR analysis of Oct4, Nanog, and Sox2 in shScr, sh1 and sh2 ESCs; data is relative to shScr.
-
O, P(O) Western blot of OCT4 during a 9‐h cycloheximide (CHX) time course treatment in shScr, sh1 and sh2 ESCs. (P) Protein degradation curves were made after quantification and normalization of the bands from (O).
-
Q, R(Q) Western blot of OCT4 during 4 and 8 h treatment with the proteasome inhibitor MG132. (R) graph bars after quantification and normalization of the bands from (Q).
Data information: Data are presented as mean ± SEM or representative images of n ≥ 3 independent biological experiments. § P < 0.05, §§ P < 0.01, §§§ P < 0.001 (D0 versus other indicated days). *P < 0.05, **P < 0.01, ***P < 0.001, n.s = no significant (shScr versus sh1 or sh2). A, B, G, H and I: unpaired Student’s t‐test; E, N, P and R: ordinary one‐way ANOVA.
Source data are available online for this figure.
