
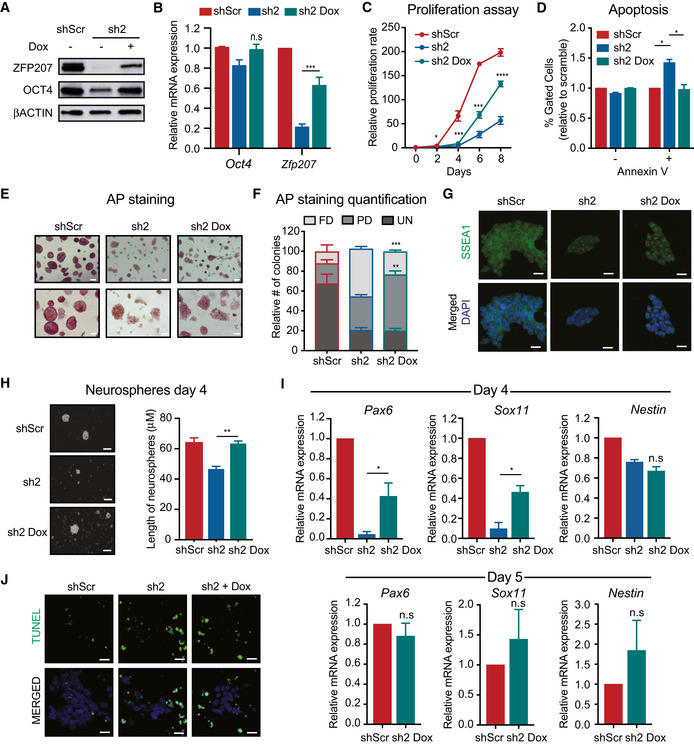
Figure EV3. Re‐expression of Zfp207 in tet(ON)‐ZFP207 KD2 rescues the ESC phenotype but it is not sufficient to fully differentiate tet(ON)‐ZFP207 KD2 to neurons.
-
A, B(A) Western blot of ZFP207 and OCT4 and (B) RT‐qPCR of Zfp207 and Oct4 in the tet(ON)‐ZFP207 cell line subjected to shScr or sh2 in the absence (−) or presence (+) of doxycycline (Dox) as indicated. mRNA levels are relative to the expression in shScr.
-
CRelative proliferation rate of tet(ON)‐ZFP207 ESCs with shScr and sh2 −/+ Dox assessed over a period of 8 days.
-
DPercentage of live (Annexin V−) and apoptotic cells (Annexin V+) in tet(ON)‐ZFP207 ESCs with shScr and sh2 −/+ Dox.
-
E, F(E) AP staining of shScr and sh2 −/+ Dox in tet(ON)‐ZFP207 ESCs. Scale bar, 50 µM. (F) Percentage of fully differentiated (FD), partially differentiated (PD) and undifferentiated (UN) ESC colonies in shScr and sh2 −/+ Dox treatment in tet(ON)‐ZFP207.
-
GImmunofluorescence analysis of SSEA1 in tet(ON)‐ZFP207 ESCs with shScr and sh2 −/+ Dox. DAPI was used as the nuclear marker. Scale bars, 20 μm.
-
HRepresentative bright‐field images (20x) and quantification of neurospheres on day 4 of differentiation. Scale bars, 200 μm.
-
IRT‐qPCR of neural‐associated markers in tet(ON)‐ZFP207 ESCs with shScr and sh2 −/+ Dox at day 4 (upper panel) and tet(ON)‐ZFP207 ESCs with shScr and sh2 +Dox at day 5 (lower panel). mRNA levels are relative to shScr.
-
JTUNEL (green) staining in tet(ON)‐ZFP207 ESCs with shScr and sh2 +Dox at day 5. Nuclei were counterstained with DAPI. Scale bar, 20 µm.
Data information: Data are presented as mean ± SEM or representative images of n ≥ 3 independent biological experiments. *P < 0.05, **P < 0.01, ***P < 0.001, ****P < 0.0001, ns = no significant difference (sh2 versus sh2 Dox). B, C, D, F and I: unpaired Student’s t‐test.
Source data are available online for this figure.