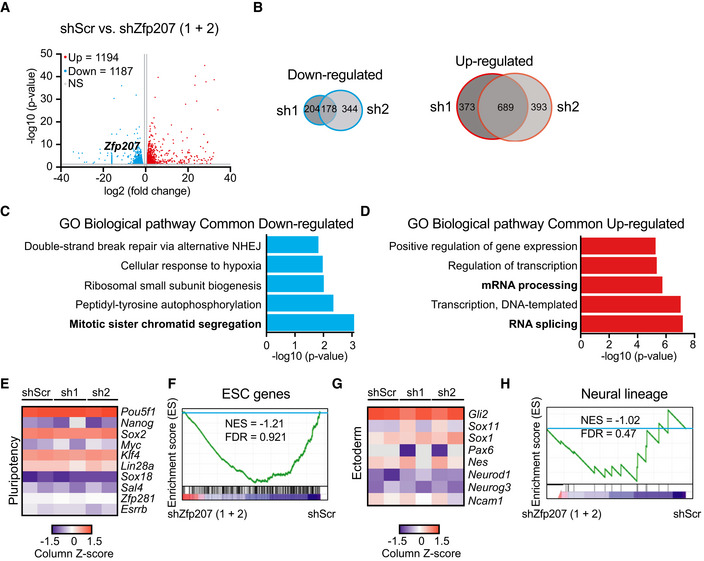
Figure 4. The neural transcriptome is not altered upon depletion of Zfp207 .

-
A, B(A) Volcano plots of common differentially expressed genes in shScr and Zfp207‐depleted (sh1 and sh2) mouse ESCs. Upregulated (Up) and downregulated (Down) genes are indicated in red and blue, respectively (P < 0.05; > 1.5‐fold). Zfp207 is depicted in black. Grey dots indicate non‐significant (NS) and < 1.5‐fold differential expressed genes. (B) Venn diagram depicting the overlap of downregulated and upregulated genes between sh1 and sh2 ESCs (FC > 1.5 and P < 0.05). FDR value was calculated with the Benjamini–Hochberg correction.
-
C, DGene ontology (GO) analysis of biological processes associated with common (C) downregulated and (D) upregulated genes in Zfp207‐depleted ESCs (sh1 and sh2); NHEJ: Nonhomologous end joining.
-
E–HHeatmap of column z‐scores of log2 transformed values of genes related to (E) pluripotency and (G) ectoderm in shScr, sh1, and sh2 ESCs. GSEA plots depicting the expression of (F) ESC‐related and (H) ectodermal genes in Zfp207‐depleted ESCs compared to shScr. High and low expression of genes is represented in red and blue color, respectively. FDR, false discovery rate; NES, normalized enrichment score.
