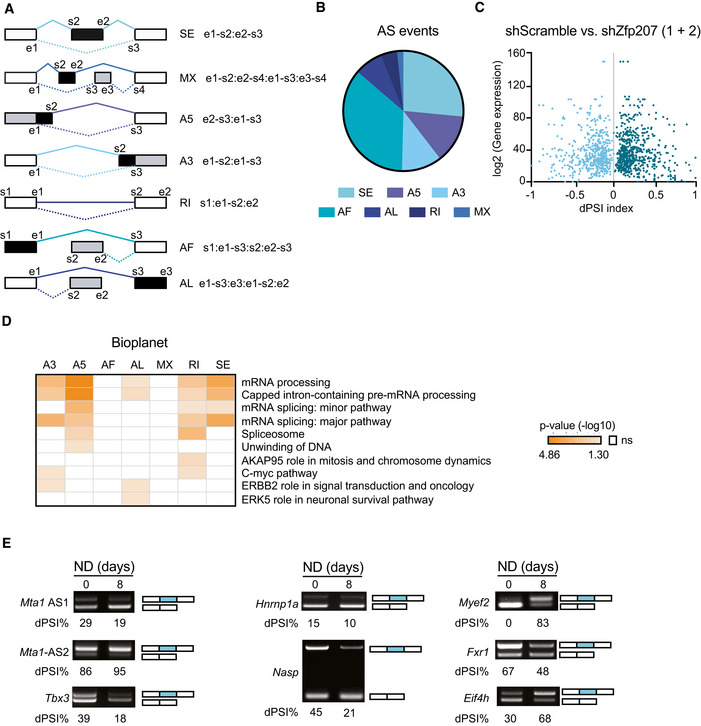
Schema depicting the types of AS events: SE, skipped exon; MX, mutually exclusive exons; A5, alternative 5′ splice‐site; A3, alternative 3′ splice site; RI, retained intron; AF, alternative first exon; AL, alternative last exon, generated by the software SUPPA2 with the specific coordinates, including start (s) and end (e). The form of the AS event is depicted in black.
Pie chart showing the AS events types distribution.
Volcano plot depicting the correlation between gene expression levels and dPSI index resulted from RNA‐seq data analysis in control (scShr) and Zfp207 depleted mouse ESCs (sh1 + sh2). Gene expression levels are presented as log2 transformed values. Differential percent spliced in index (dPSI) range is between −1 and +1.
Gene ontology enrichment analysis with Bioplanet software for genes undergoing different splicing events upon Zfp207 depletion (sh1 and sh2).
Representative RT‐PCR analysis of AS events upon neural differentiation in mouse ESCs for Mta1 (AS1 and AS2), Tbx3, Hnrnp1a, Nasp, Myef2, Fxr1, and Eif4H. The structure of each isoform is indicated (not to scale). Alternative exons are blue. PSI was quantified for each condition.

