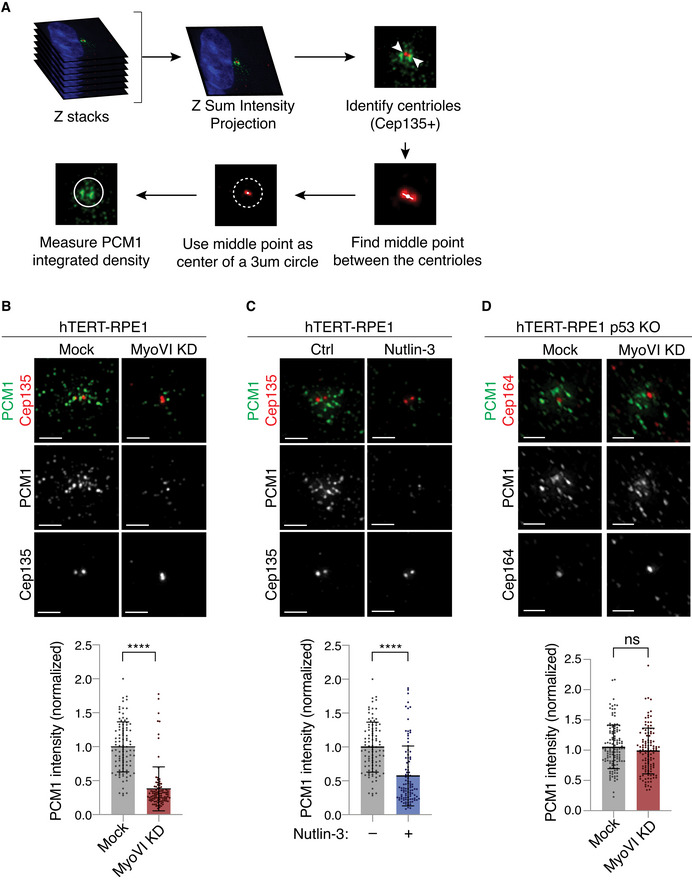
Figure 5. Myosin VI depletion affects the centriolar satellites via p53.

- A scheme of the IF analysis performed to calculate the total intensity of satellite staining that surrounds the centrioles. The centriole marker Cep135 or Cep164 are used to define the centre of a 3 μm circle, in which the intensity of the satellite marker PCM1 was calculated.
- IF analysis of PCM1 signal. hTERT‐RPE1 cells were transfected with siRNA against myosin VI and immunostained with anti‐PCM1 and anti‐Cep135 antibodies. Upper panel, representative images, scale bar, 2 μm. Lower panel, quantification of PCM1 intensity. Results are expressed as fold change with respect to mock average intensity. Bars represent mean ± SD. Mock, n = 96 cell; MyoVI KD, n = 98 cells, from two independent experiments. ****P < 0.0001 by Mann–Whitney test.
- IF analysis of PCM1 signal. hTERT‐RPE1 cells were treated with Nutlin‐3 for 24 h and immunostained with anti‐PCM1 and anti‐Cep135 antibodies. Panels as in B. Mock, n = 96 cells; Nutlin‐3, n = 100 cells, from two independent experiments. ****P < 0.0001 by Mann–Whitney test.
- IF analysis of PCM1 signal. hTERT‐RPE1 p53 KO cells were transfected with siRNA against myosin VI and immunostained with anti‐PCM1 and anti‐Cep164 antibodies. Panels as in (B). Quantification of PCM1 intensity refers to a 3 μm circle around the mother centriole, identified with anti‐Cep164 staining. Mock, n = 128 cells; MyoVI KD, n = 114 cells from three independent experiments. ns, not significant by Mann–Whitney test.
Source data are available online for this figure.
