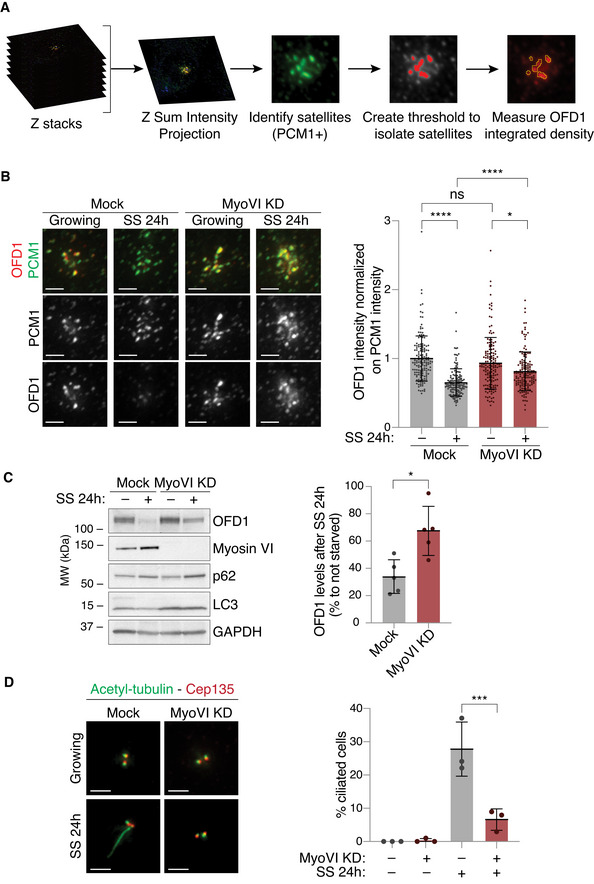
Figure 6. Myosin VI contributes to OFD1 removal from the centriolar satellites required for ciliogenesis.

- A scheme of the IF analysis performed to calculate the total intensity of OFD1 staining at the centriolar satellites.
- IF analysis of OFD1 signal at the centriolar satellites upon serum starvation. hTERT‐RPE1 p53 KO cells were transfected with siRNA against myosin VI. After four days, cells were fixed (growing) or serum starved for 24 h (SS). Cells were immunostained with anti‐OFD1 and anti‐PCM1 antibodies. The intensity of OFD1 signal in the area covered by PCM1 was quantified and normalised against the intensity of PCM1 staining in the same area. Left, representative images, scale bar, 2 μm. Right, results are expressed as fold change with respect to mock average intensity. Bars represent mean ± SD. Mock_growing, n = 150 cells; Mock_SS, n = 149 cells; MyoVI KD_growing, n = 149 cells; MyoVI KD_SS, n = 150 cells, from three independent experiments. ns, not significant; *P < 0.05; ****P < 0.0001 by Kruskal–Wallis test.
- IB analysis of OFD1 after serum starvation in control and myosin VI‐depleted cells. hTERT‐RPE1 p53 KO cells were transfected with siRNA against myosin VI. After four days, cells were serum starved for 24 h (SS). Lysates were analysed by IB with anti‐OFD1, anti‐myosin VI, anti‐p62 and anti‐LC3 antibodies. Anti‐GAPDH was used as loading control. The amount of OFD1 protein was normalised against GAPDH signal and is expressed as percentage of OFD1 levels in cells grown in serum‐starved conditions compared to cells grown in media containing serum. Bars represent mean ± SD. n = 5 independent experiments. *P < 0.05 by Kruskal–Wallis test.
- IF analysis of primary cilium upon serum starvation. hTERT‐RPE1 p53 KO cells were transfected with siRNA against myosin VI. After four days, cells were fixed (growing) or serum starved for 24 h (SS). Cells were immunostained with anti‐acetylated tubulin (to identify the cilia), anti‐Cep135 (to identify the centrioles) and DAPI. Left, representative images, scale bar, 2 μm. Right, results are expressed as fold change with respect to mock average intensity. Bars represent mean ± SD. n = 3 independent experiments. 100–200 cells/condition were counted for each experiment. ***P < 0.001 by two‐way ANOVA test.
Source data are available online for this figure.
