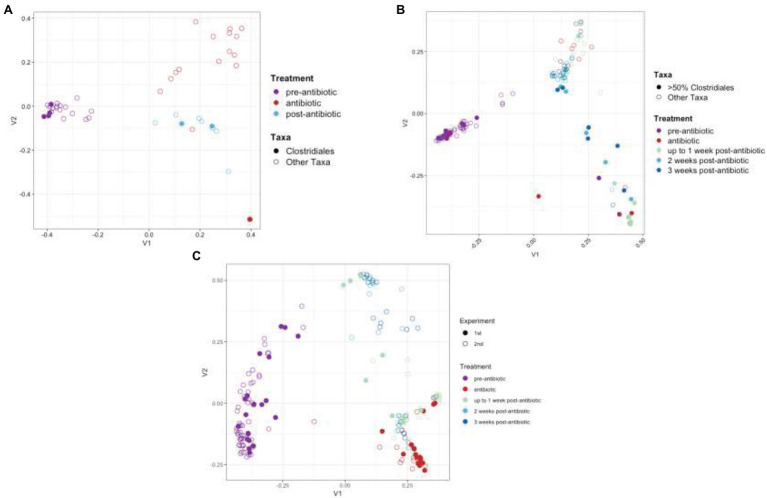
Figure 2.
Principal coordinate analysis (PCoA) of taxonomic profiles. PCoA analysis based on the Bray-Curtis distance matrix of OTUs from TZP1 (A) and TZP2 (B) experiments. Each circle represents a single mouse at a single time point. Closed circles represent mice that had >50% Clostridiales (OTU-1 in A, OTU-3 in B) at any time point and open circles represent all other mice. (C) PCoA analysis on Bray-Curtis distance matrix based on combined genera profiles from both experiments. Note that the number of bullets per panel may vary as a consequence of the number of mice per group and the number of samples taken and analyzed in full per individual mouse.

