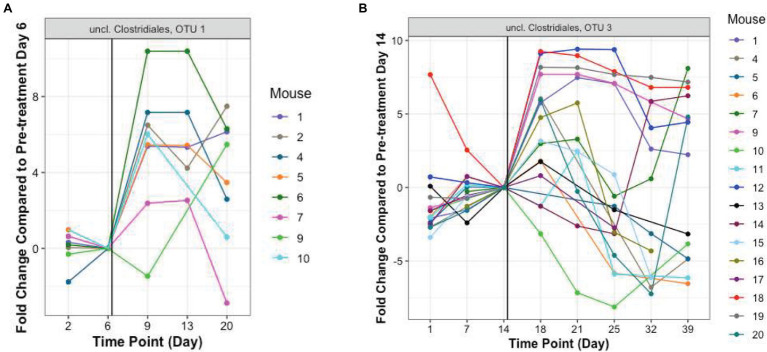
Figure 6.
Resistant Clostridiales OTUs. The fold change of relative abundance of Clostridiales OTUs 1 and 3, (A,B, TZP1 and TZP2, respectively) compared to the last pre-antibiotic time point (Days 6 and 14, respectively) are plotted for each day. The vertical line indicates the approximate first TZP exposure. Mice 1–10 were immunocompetent while mice 11–20 were neutropenic.

