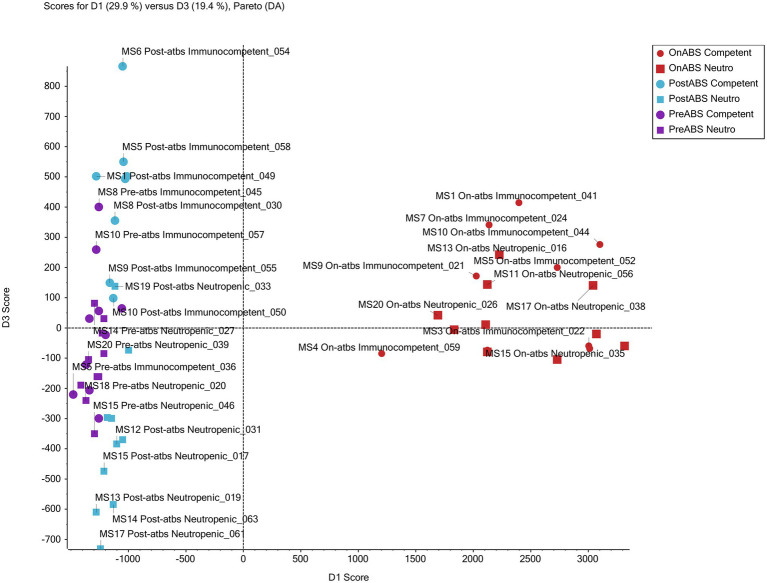
Figure 9.
Metabolomic profiling. Principal component analysis of non-targeted TripleTOF mass spectrometer (MS) data of mouse feces successfully grouped treatment from non-treatment mice. The scores plot for PC1 and PC3 of MS features in positive ion mode shows good separation of the antibiotic vs. non-antibiotic time points. Furthermore, clusters of post-antibiotic immunocompetent and post-antibiotic neutropenic features also show good separation from each other with immunocompetent clustering above and neutropenic below the x-axis.

