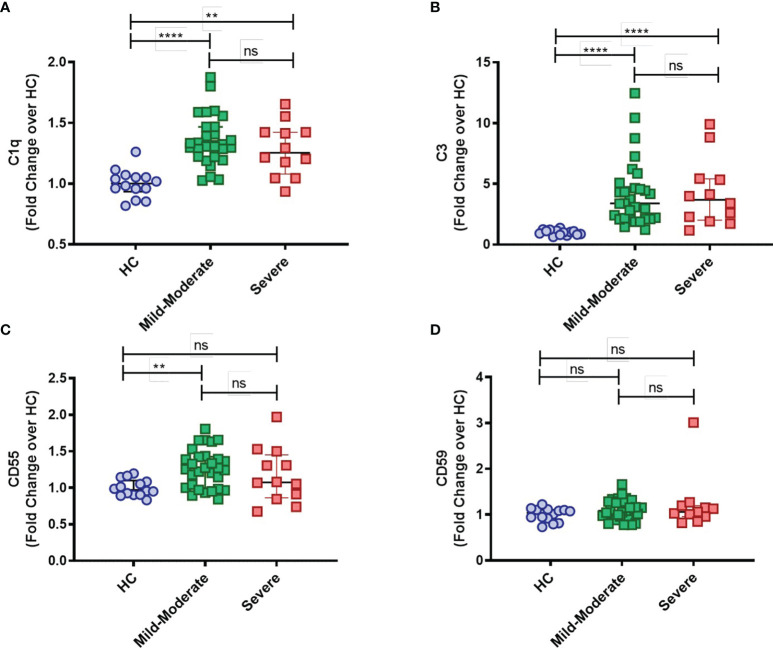
Figure 2.
Complement deposition on circulating blood monocytes from COVID-19 stratified by disease status. The mean fluorescence intensity (MFI) of C1q (A), C3 (B), CD55 (C) and CD59 (D) expression on circulating blood monocytes was compared among healthy controls (HC) (n = 14), COVID-19 Mild to Moderate patients (n = 30) and Severe patients (n = 12) by flow cytometry. Data are presented as Fold change over their respective experimental HC mean, and graphs depict median and interquartile range. Data were analyzed using the Kruskal-Wallis test. **P < 0.01, ****P < 0.0001; ns, not significant.

