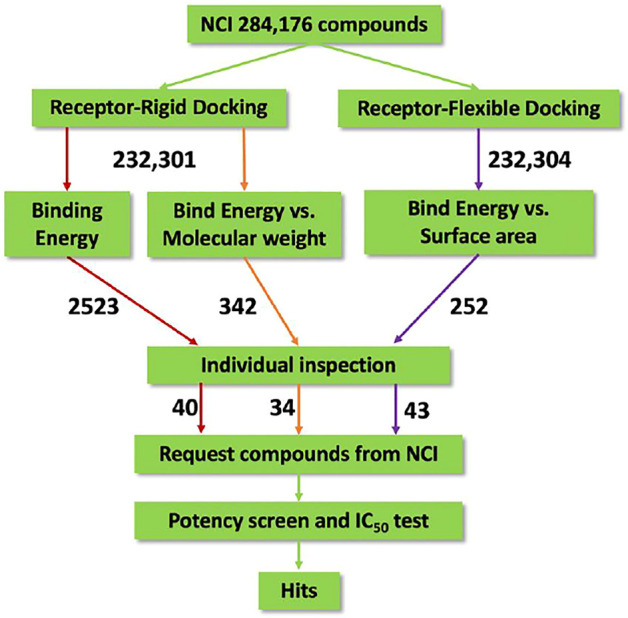
FIGURE 1.

Flow diagram of the integrated virtual screen strategy. The diagram includes data preparation, docking methods, post-docking filtering, individual inspection, and in vitro potency test. The arrow is labeled with the number of compounds flowing along the respective colored path for assessment.
