
Figure EV1. Alternative splicing and PCR analysis of Stim1 and exon A.
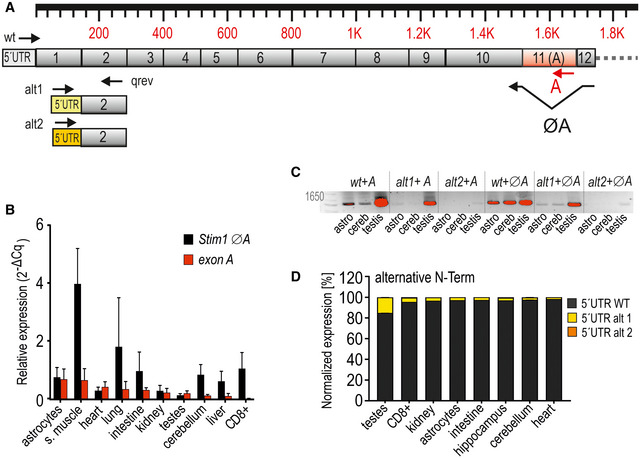
- Schematic exon structure of Stim1 with conventional exons depicted in gray. Highlighted in red is the alternative exon 11 (A). Alternative usage of 5’UTR regions is indicated with alt1 and alt2. Annealing sites of primers are depicted as arrows.
- Expression of exon A and ØA (wt) normalized to TATA box‐binding protein Tbp (mean ± SD) as determined by qRT–PCR from cDNA templates isolated from indicated tissues and cells derived from 3 to 4 mice.
- Analytic PCR with reverse primers flanking the A splice site or within exon A in combination with forward primers specific for 5´URT wt, alt1, or alt2 as also depicted in (A) using cDNA of murine astrocytes, cerebellum, and testis. Abbreviations: astro = astrocytes, cereb = cerebellum. Red indicates saturated pixels (see text).
- Quantification of alternative N‐term splicing via qRT–PCR. Expression levels were normalized to Tbp.