
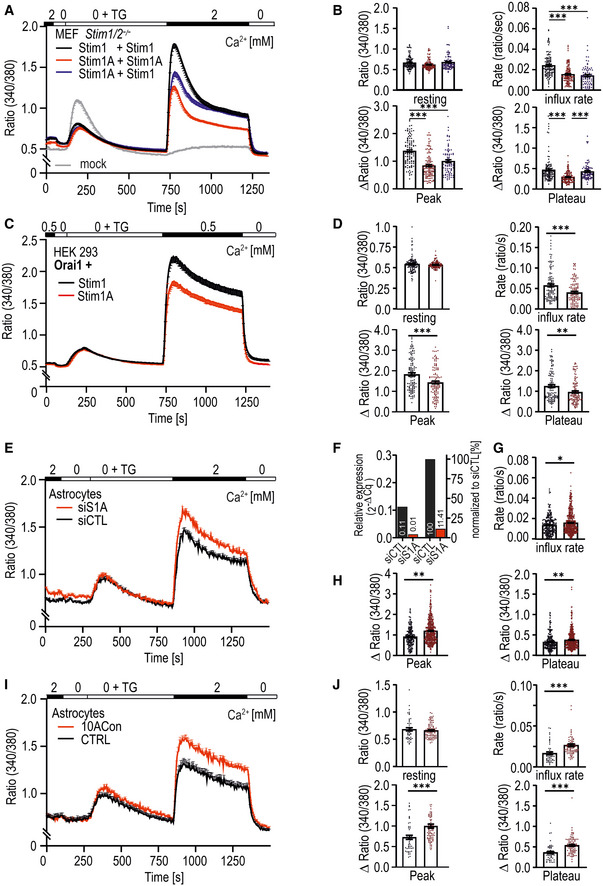
Figure 2. Stim1A reduces SOCE.
-
ATraces showing average changes (mean ± s.e.m.) in intracellular Ca2+ (Fura‐2 ratio) over time in response to perfusion of different [Ca2+]o as indicated in the upper bar in MEF Stim1/Stim2−/− cells transfected with Stim1 (black trace, n = 111), Stim1A (red trace, n = 116), and the combination of Stim1 with Stim1A (blue trace, n = 86) or with vector only (gray trace, n = 79).
-
BQuantification of changes in ratio of resting, influx rate (Δratio/time), Δpeak, and Δplateau measured in A. ***P < 0.001, Kruskal–Wallis ANOVA.
-
CTraces showing average changes (mean ± s.e.m.) in intracellular Ca2+ (Fura‐2 ratio) in HEK293 cells co‐transfected with Orai1 and either Stim1‐ (black trace, n = 119) or Stim1A‐IRES‐mCherry (red trace, n = 118).
-
DQuantification of changes in ratio of resting, influx rate (Δratio/time), Δpeak, and Δplateau measured in C. **P < 0.01 and ***P < 0.001, Mann–Whitney test.
-
ETraces showing average changes (mean ± s.e.m.) in intracellular Ca2+ (Fura‐2 ratio) in primary astrocytes after transfection with non‐silencing (siCTL, black trace, n = 216) or exon A‐specific siRNA (siS1A, red trace, n = 263).
-
FEfficiency of siRNA as determined by qRT–PCR.
-
G, HQuantification of parameters shown in (E). *P < 0.05 and **P < 0.01, Mann–Whitney test.
-
ITraces showing average changes (mean ± s.e.m.) in intracellular Ca2+ (Fura‐2 ratio) in primary astrocytes from C57BL/6 wt (CTRL, black trace, n = 49) and splice‐deficient C57BL/6 10ACon mice (10ACon, red trace, n = 82).
-
JQuantification of parameters determined in [I]. ***P < 0.001, Mann–Whitney test.
Data information: Data (except F) were obtained from three biological replicates (e.g., transfections) each with three measured dishes (technical replicates) with multiple cells each (yielding a total number n) and are shown as mean ± s.e.m.