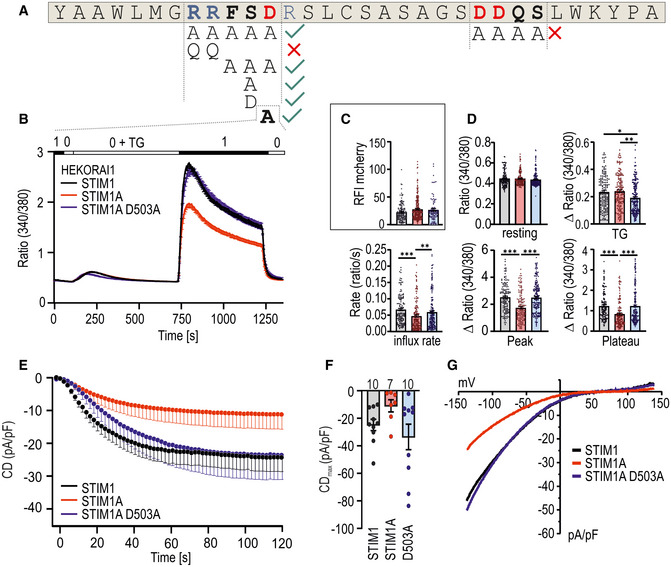
Figure 4. Mutation of D503 rescues phenotype of domain A.

- Amino acids of exon A. Positive charged amino acids are marked blue, and negative charged ones are shown in red. Mutated regions are in bold, and different mutant combinations investigated in Fig EV5 are depicted below.
- Traces showing average changes (mean ± s.e.m.) in intracellular Ca2+ (Fura‐2 ratio) over time in response to perfusion of different [Ca2+]o as indicated in the upper bar with constructs as indicated expressed in HEKO1. STIM1 (black, n = 145), STIM1A (red, n = 157), and STIM1A_D503A (n = 185).
- Relative fluorescence intensities of mCherry‐tagged constructs measured in (B).
- Quantification of changes in resting ratio, TG peak (∆ ratio), and SOCE parameters measured in B.
- Average traces showing whole‐cell current density (CD) over time extracted at −80 mV in HEKO1 cells transfected with STIM1 (black), STIM1A (red), or STIM1A_D503A (blue).
- Average maximum CDs recorded from cells measured in E (n within bars).
- Average current–voltage (I–V) relationship of all cells recorded in E.
Data information: *P < 0.05, **P < 0.01, and ***P < 0.001, Kruskal–Wallis ANOVA with Dunn's multiple comparisons test. Data points (total n) were obtained from three biological replicates each with three technical replicates (each with multiple cells) and are shown as mean ± s.e.m for traces and as scatter plots with the underlying boxes showing the means for individual parameters.
