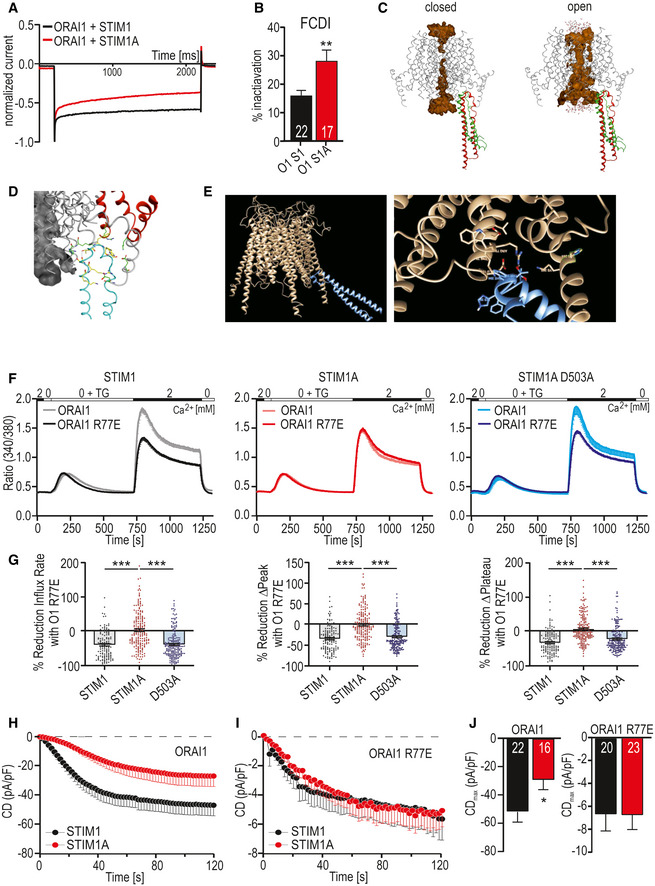
Figure 5. Mutation within the ORAI1 ETON region masks the STIM1A phenotype.

-
AExemplary normalized current responses at −120 mV pulse showing fast Ca2+‐dependent inactivation (FCDI).
-
BPercentage of FCDI (plateau/peak, mean ± s.e.m.), for HEKS1/S2−/− cells transfected with STIM1+ORAI1 (O1 S1), 22 patch‐clamped cells or transfected with STIM1A and ORAI1 (O1 S1A, 17 cells) from three independent transfections.
-
CDocking model of the STIM1 CAD domain to ORAI at the beginning (red) and at the end (green) of a 50‐ns MD simulation.
-
DClose‐up of interacting residues.
-
EAlternate docking approach.
-
FTraces showing average changes (mean ± s.e.m.) in intracellular Ca2+ (Fura‐2 ratio) over time in response to perfusion of different [Ca2+]o as indicated in the upper bar with constructs as indicated expressed in HEKS1/S2−/−.
-
GQuantification of the relative reduction of ratio/time or ratio for cells (135 < n < 202) measured in (F).
-
H, IAverage traces (mean ± s.e.m.) showing whole‐cell current density (CD) over time extracted at −80 mV in HEKS1/S2−/− cells co‐transfected either with STIM1 (black) or STIM1A (red) and ORAI1 (H) or with ORAI1 R77E (I) and recorded using extracellular solution containing 2 mM Ca2+.
-
JAverage maximum CDs recorded from cells measured in [H,I] (n within bars).
Data information: In G, ***P < 0.001, Kruskal–Wallis ANOVA with Dunn’s multiple comparisons test; in B, J, *P < 0.05 and **P < 0.01, unpaired t‐test with Welch’s correction. Data points (total n) were obtained from three biological replicates each with three technical replicates (with multiple cells) and are shown as mean ± s.e.m for traces (F) and as scatter plots with the underlying boxes showing the means for individual parameters (G). For patch‐clamp experiments, numbers in bars (B, J) indicate measured cells, which were from three independent transfections.
